
Century 21 People’s Choice Realty Inc., Brokerage
120 MATHESON BLVD E #103
MISSISSAUGA, Ontario
L4Z 1X1


Toronto, Ionview, M1K 3B1
$899,000
Listed by ROYAL LEPAGE SIGNATURE REALTY.
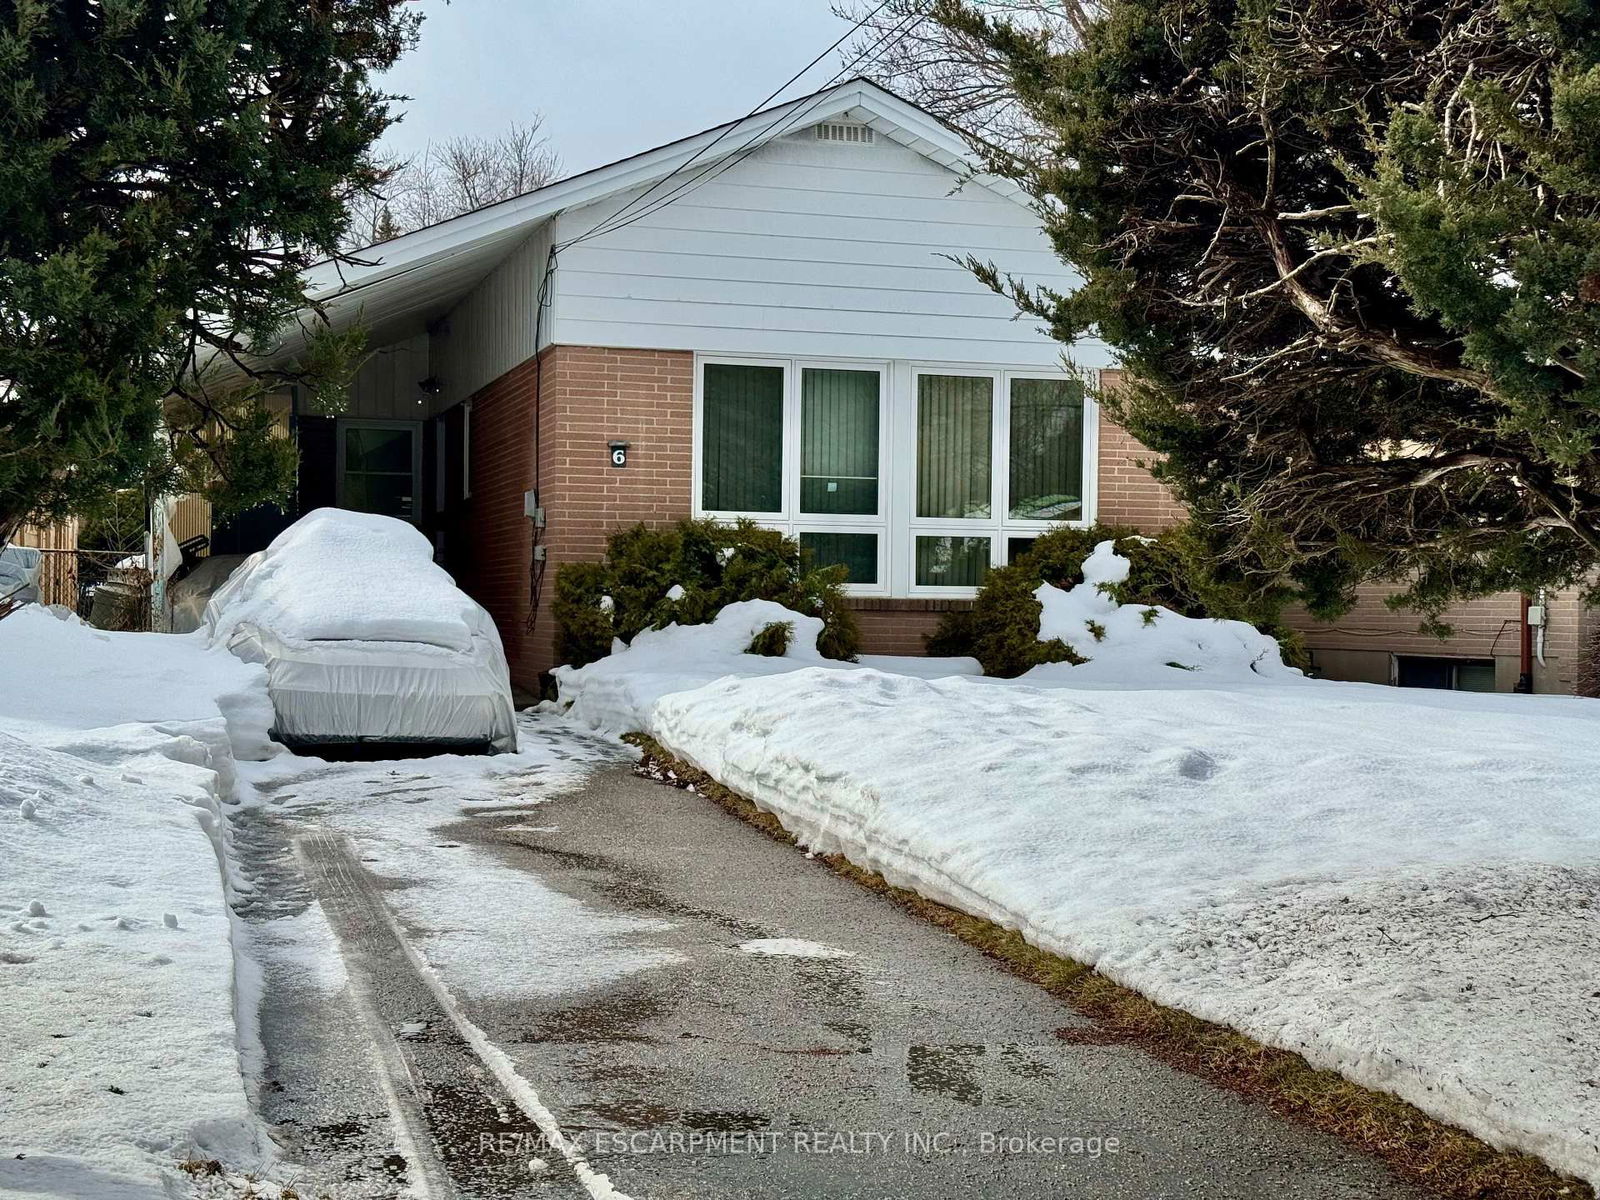
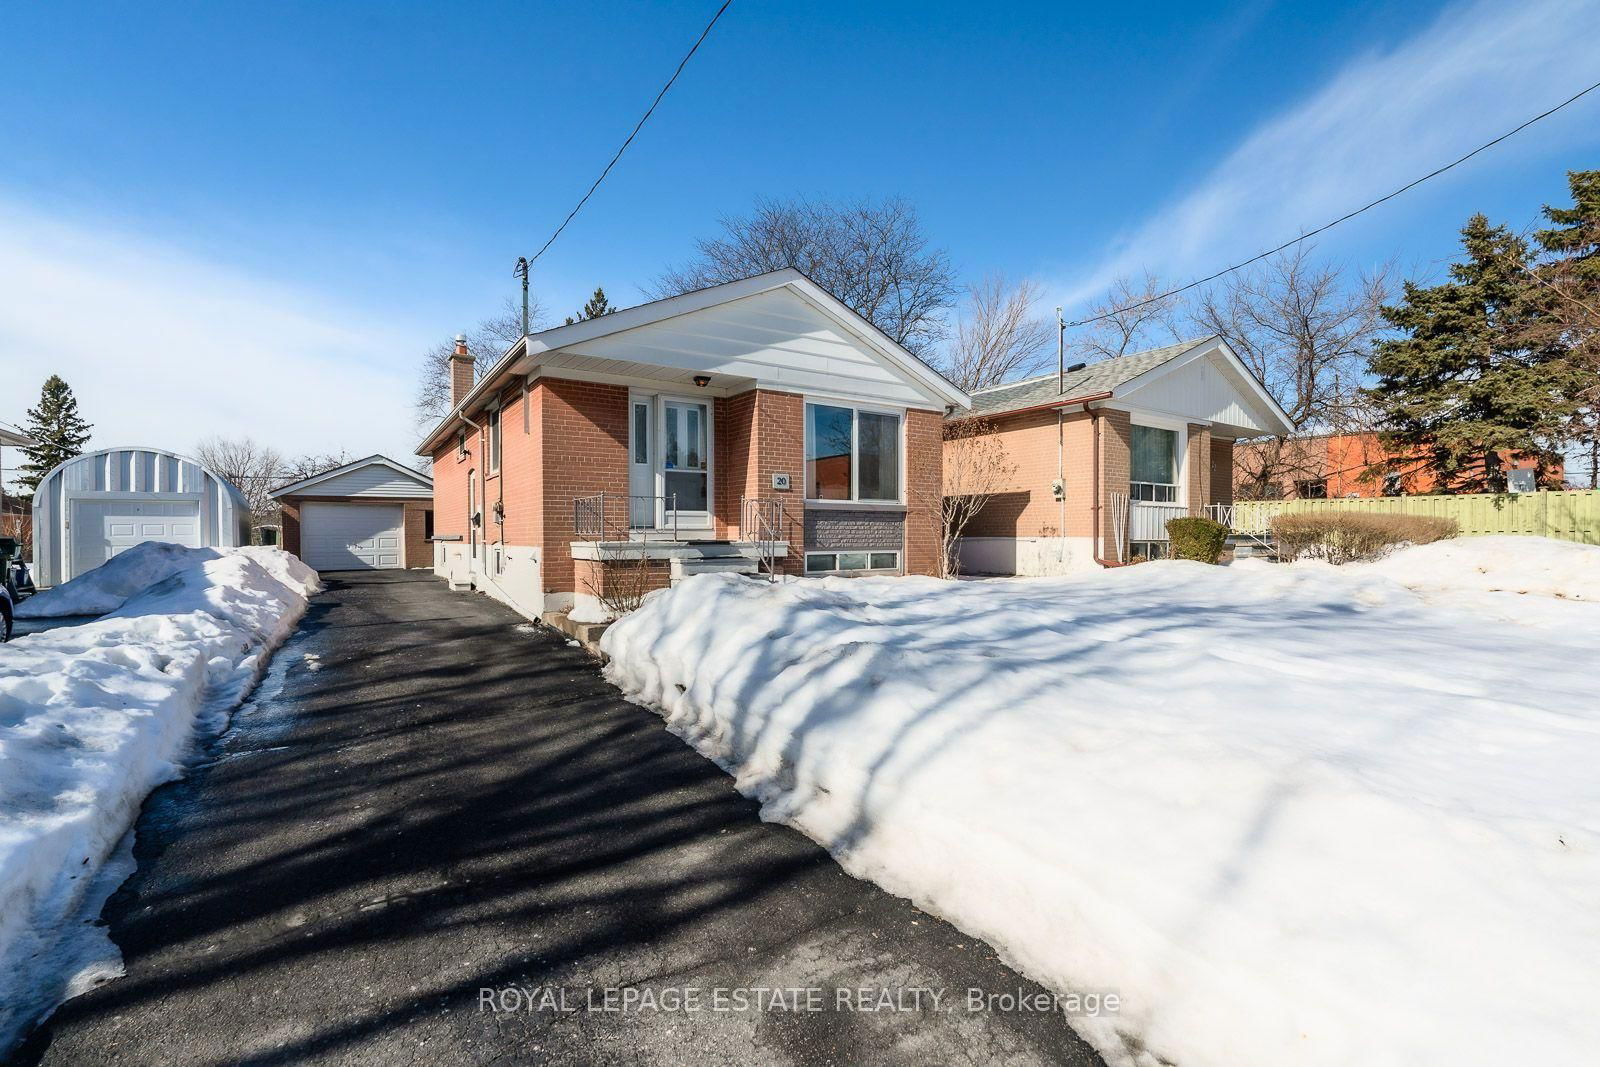
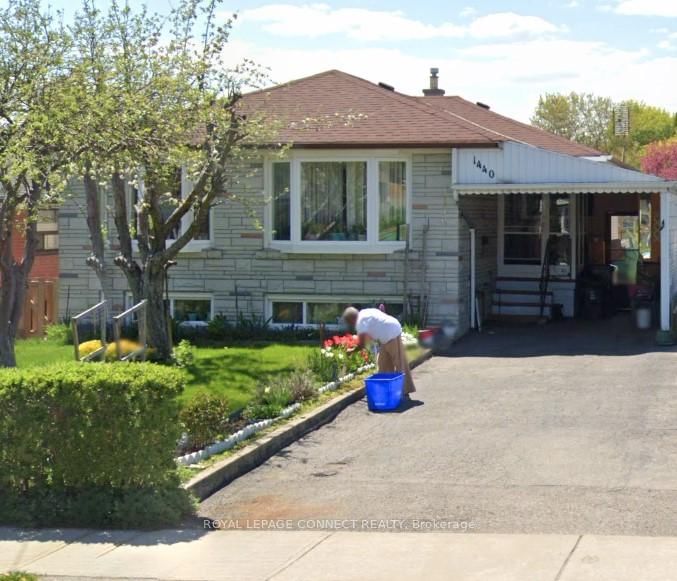
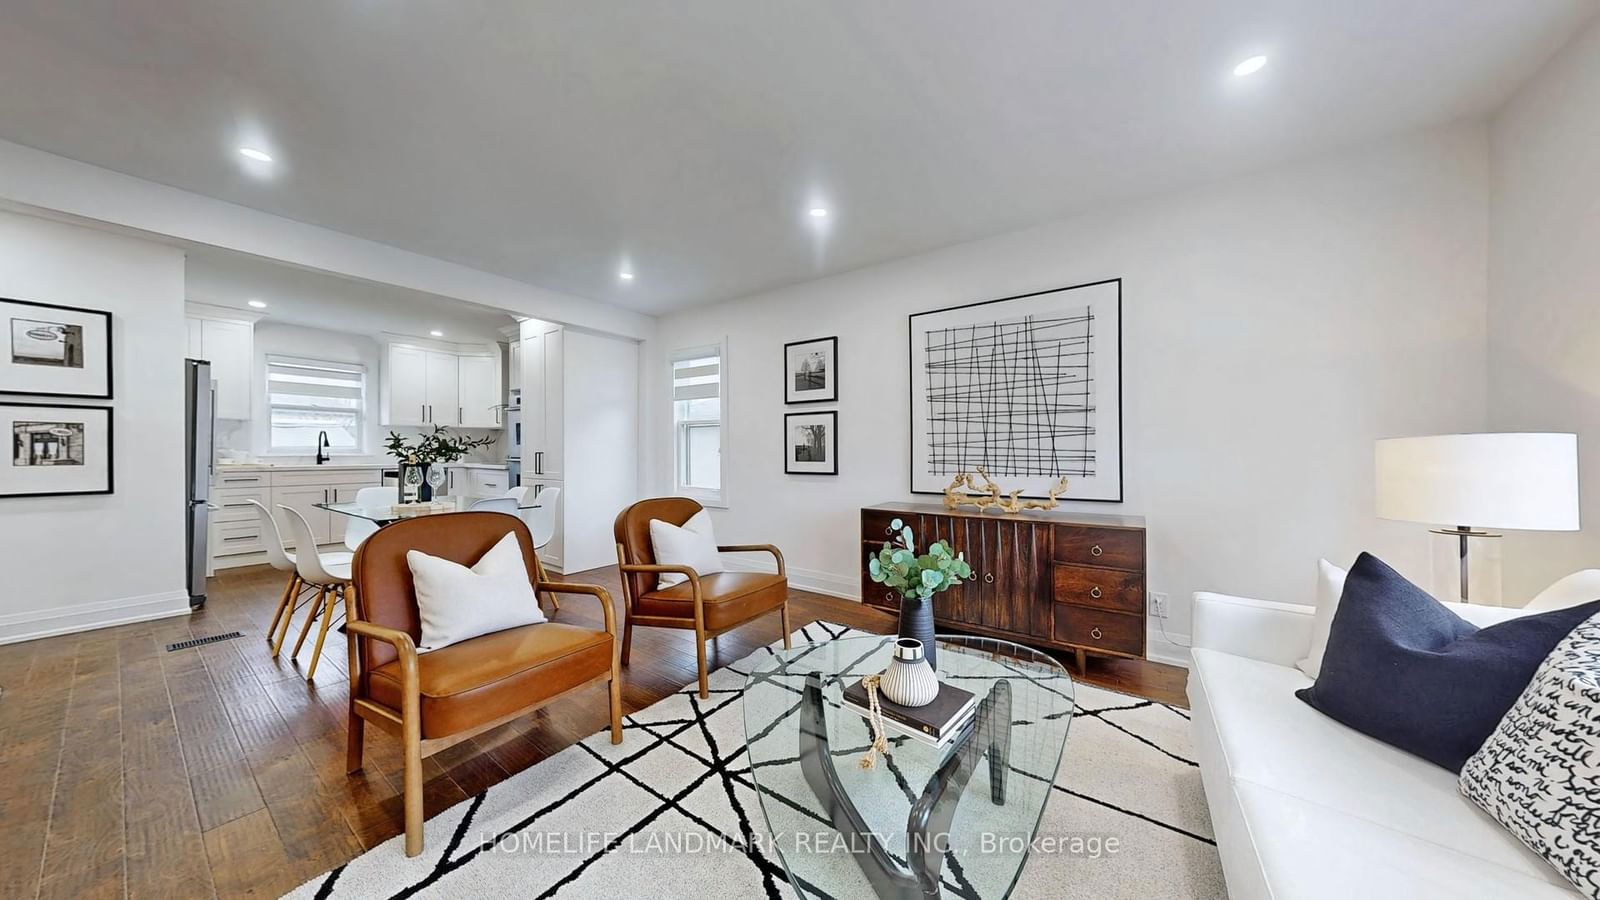
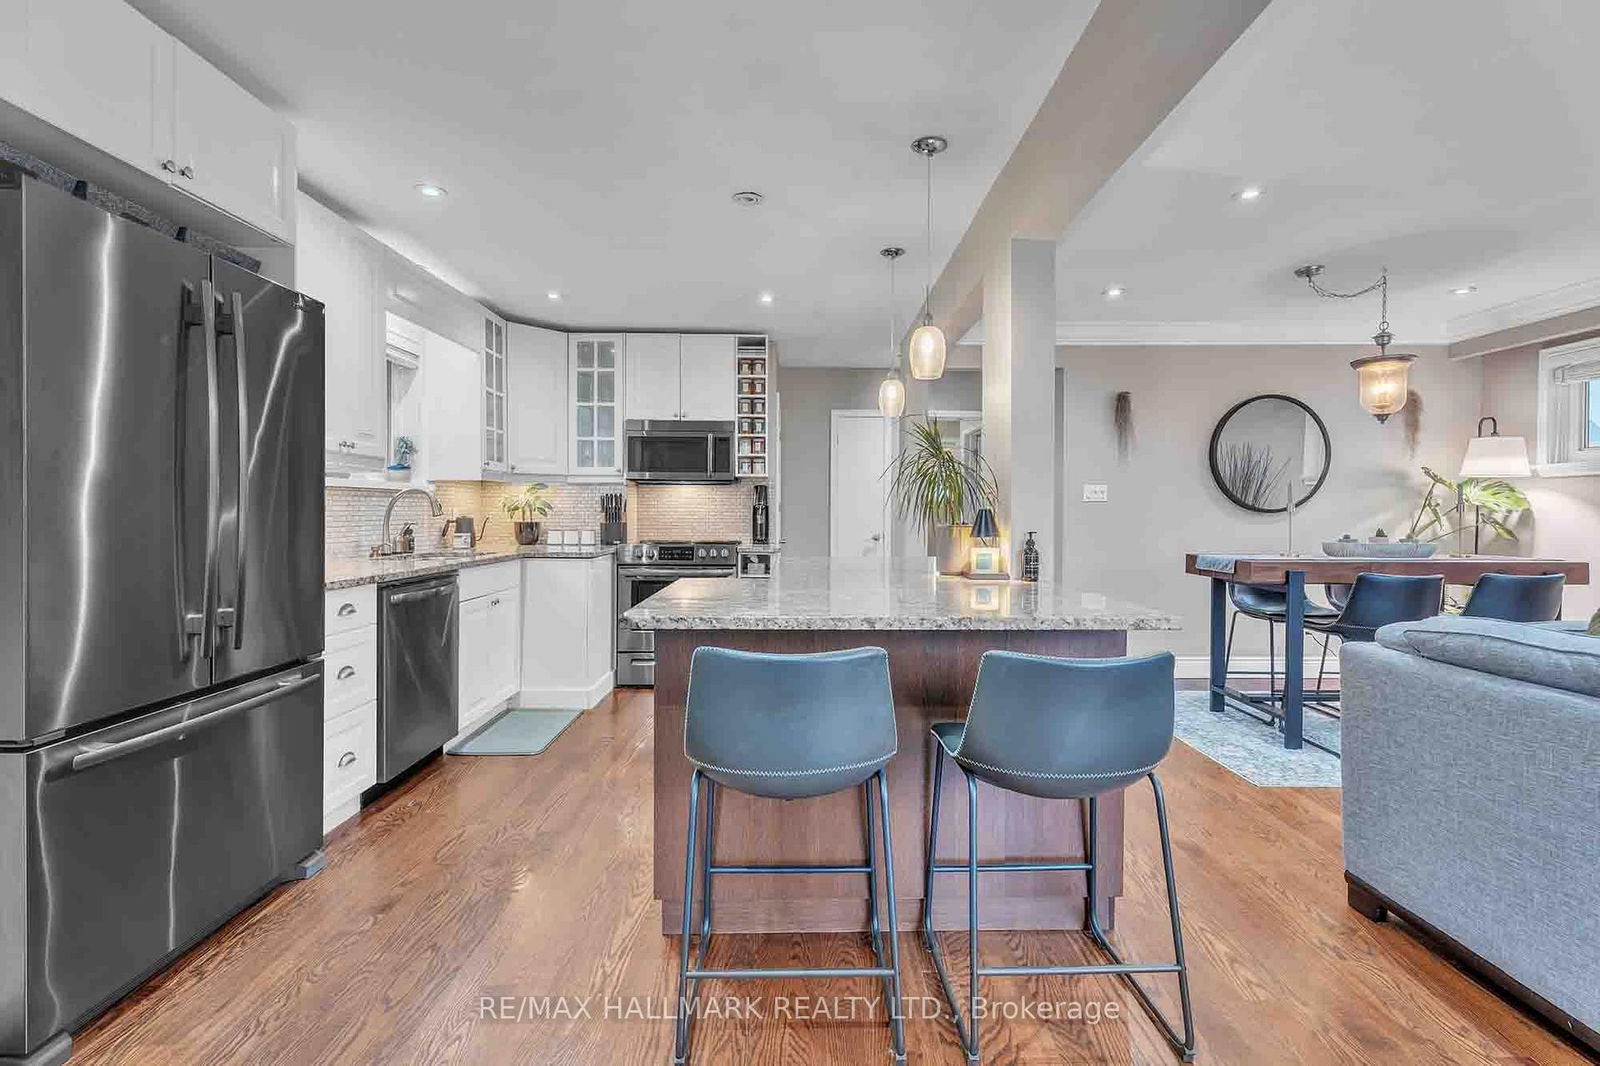
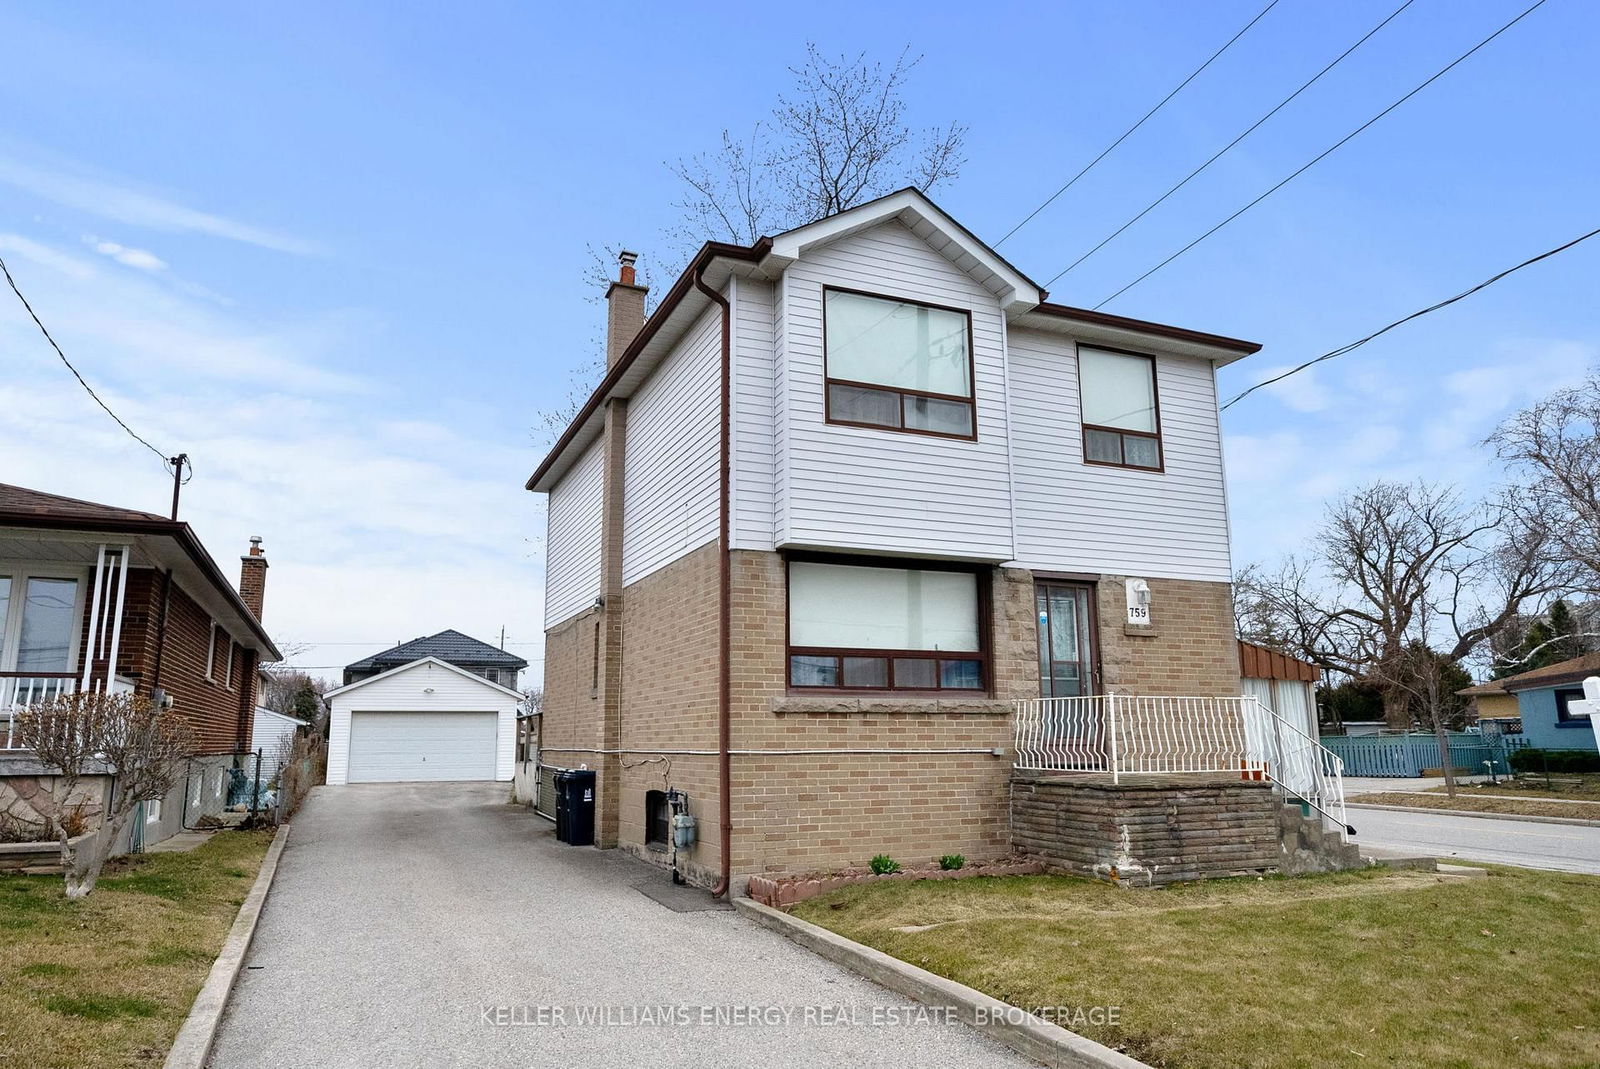
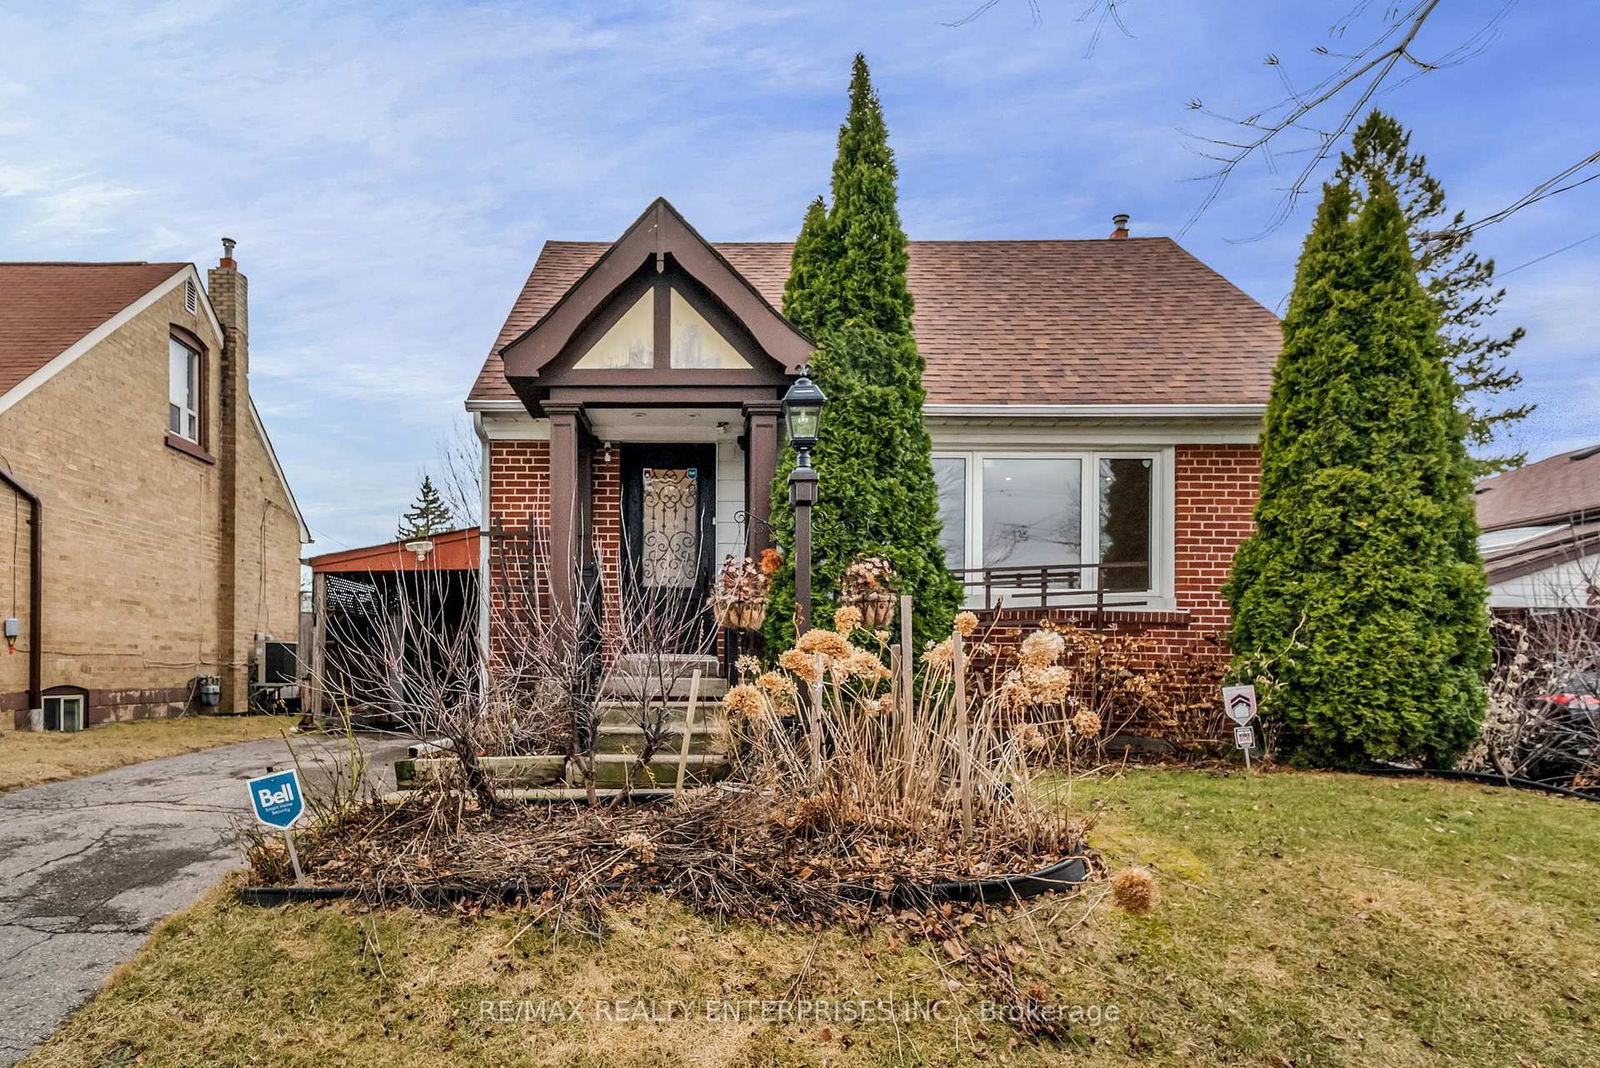
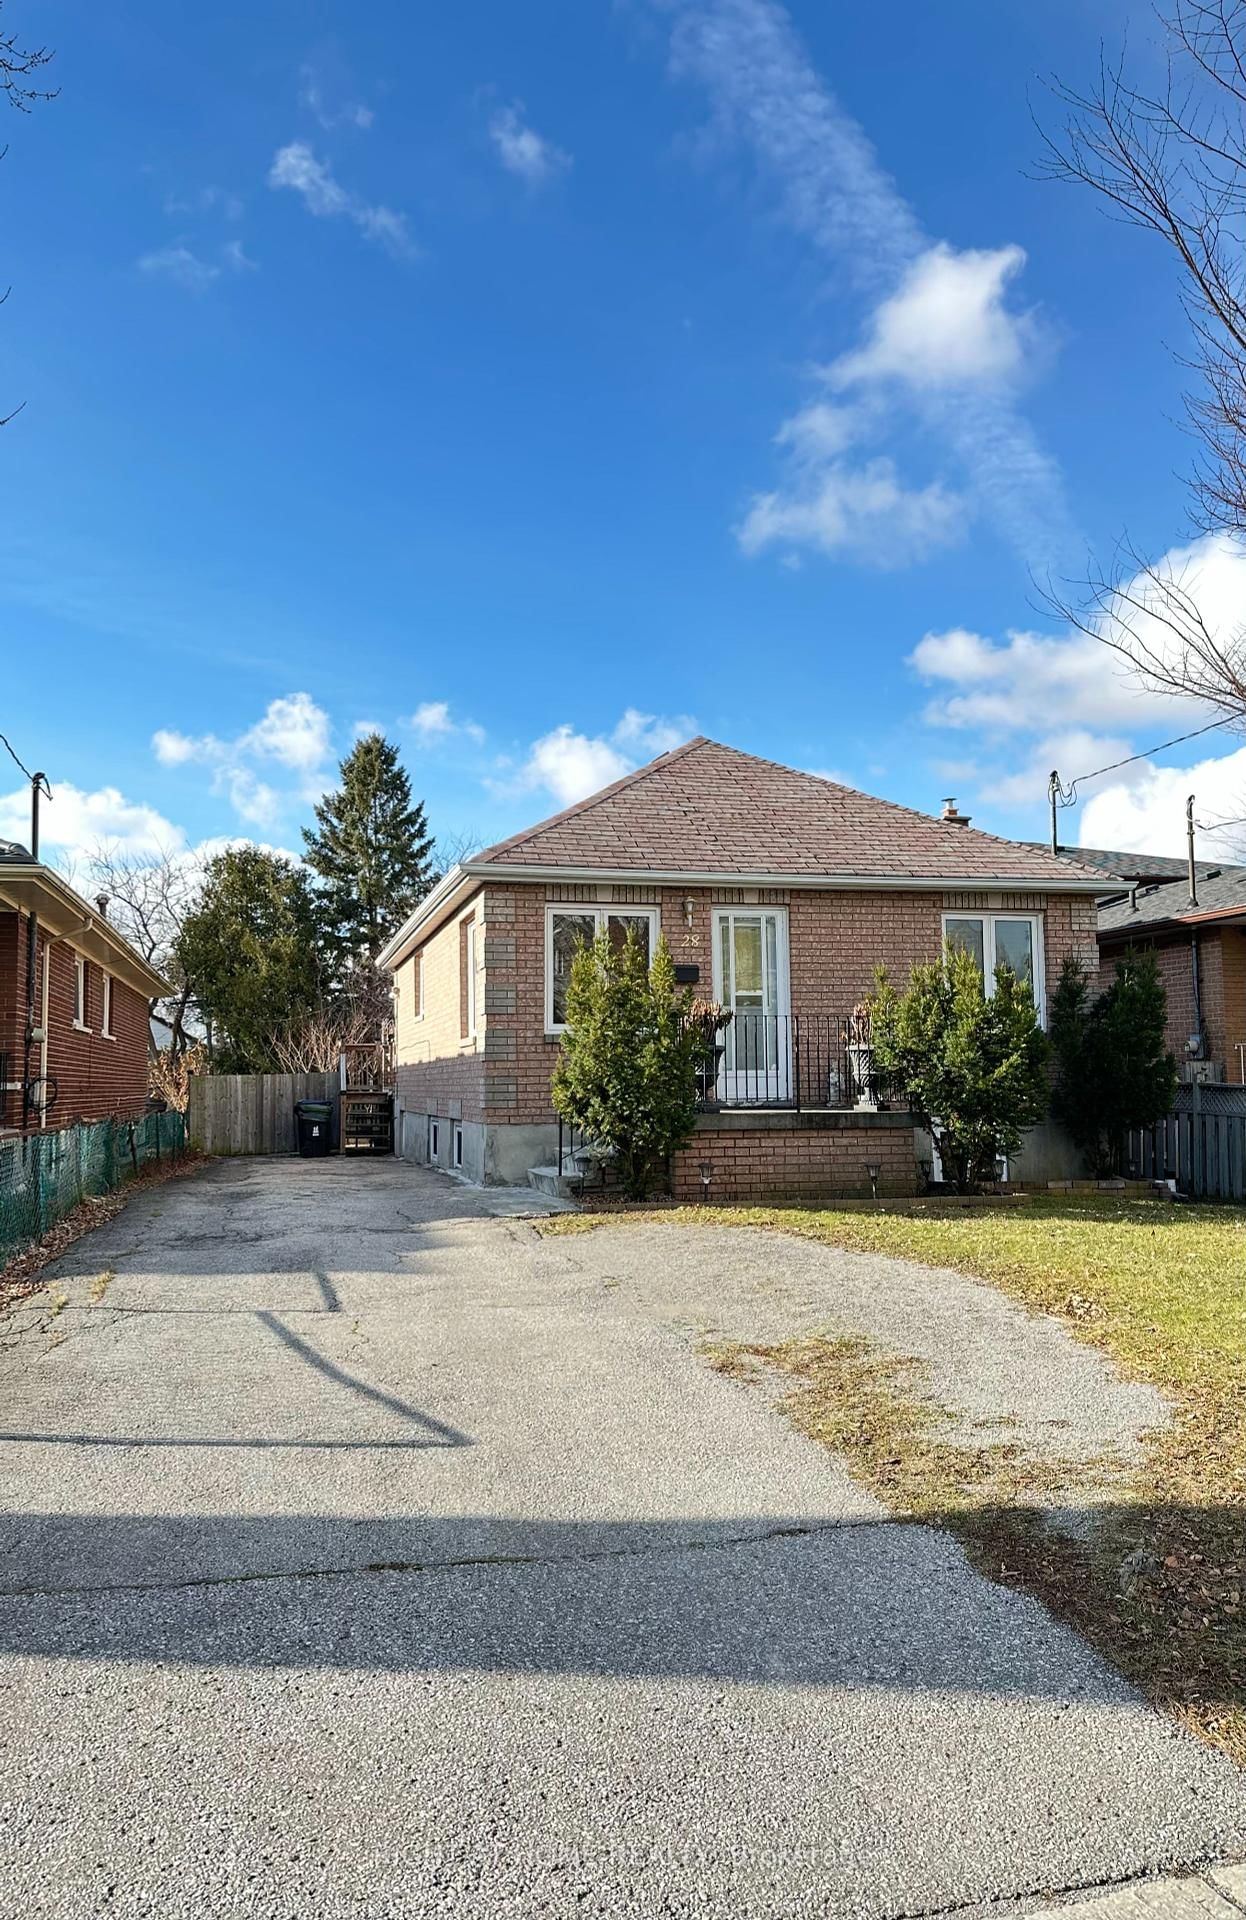
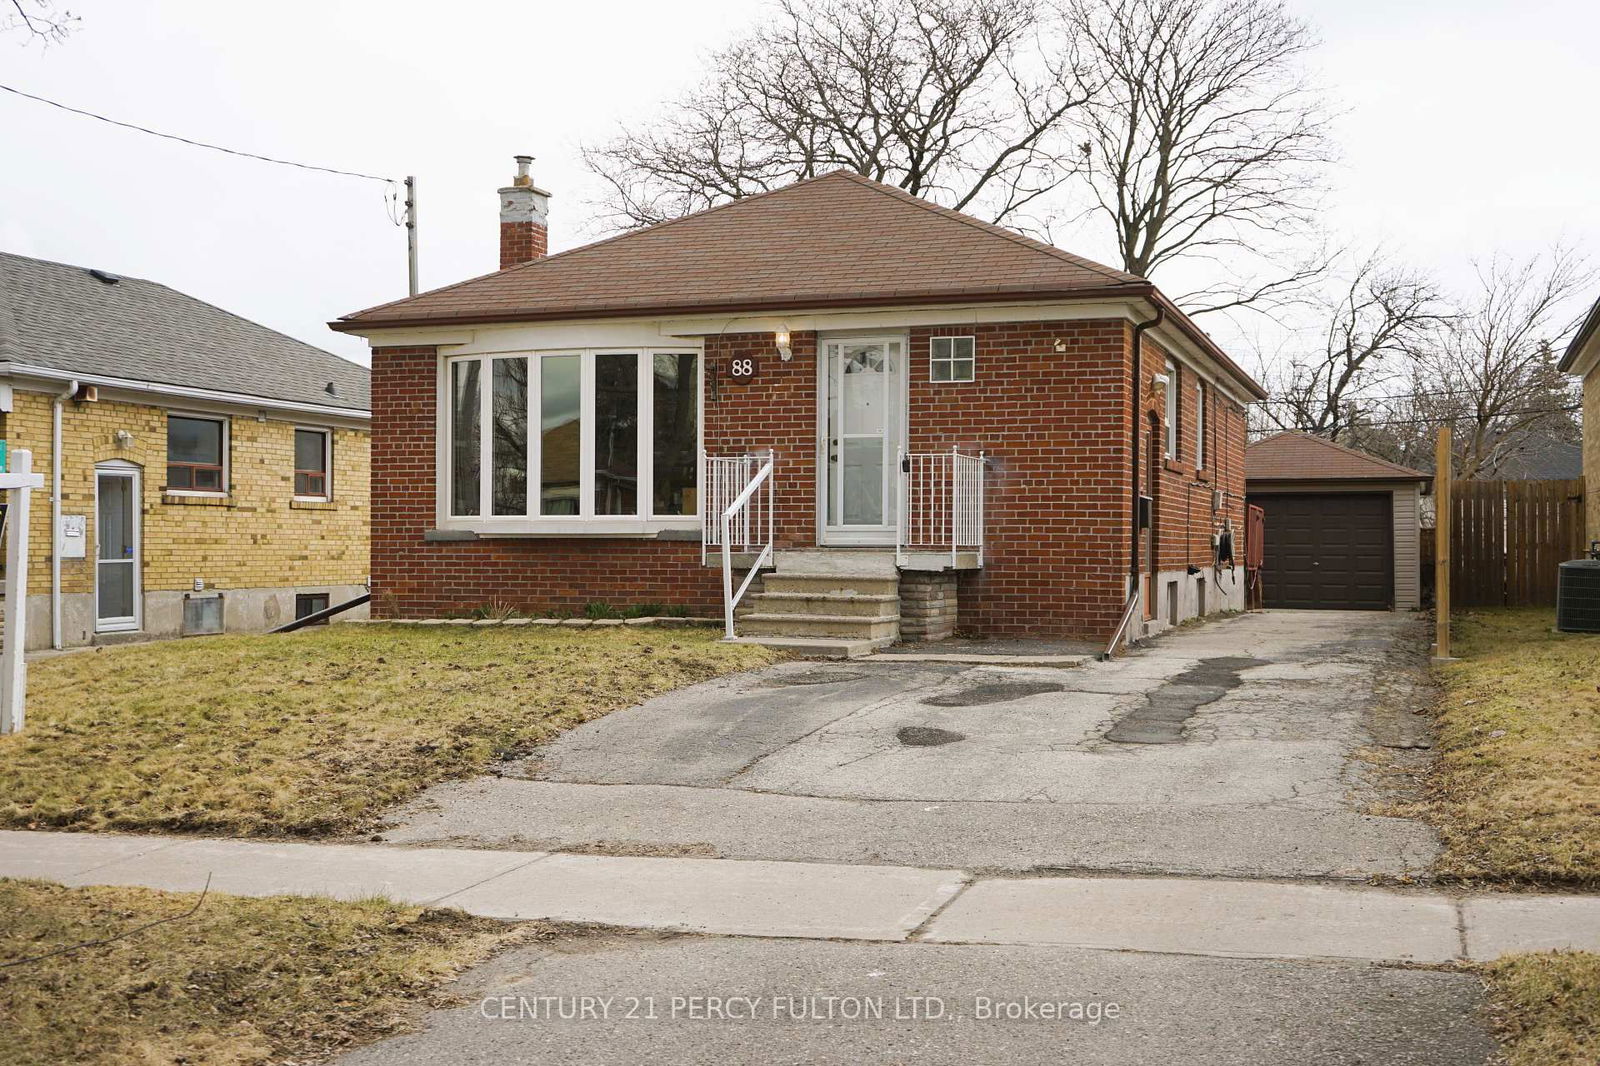
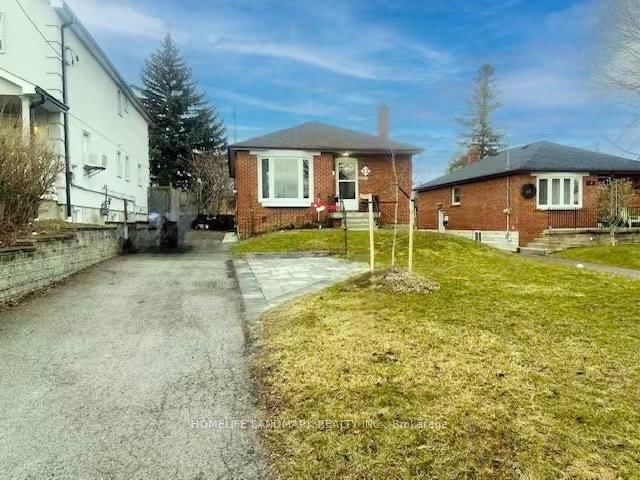
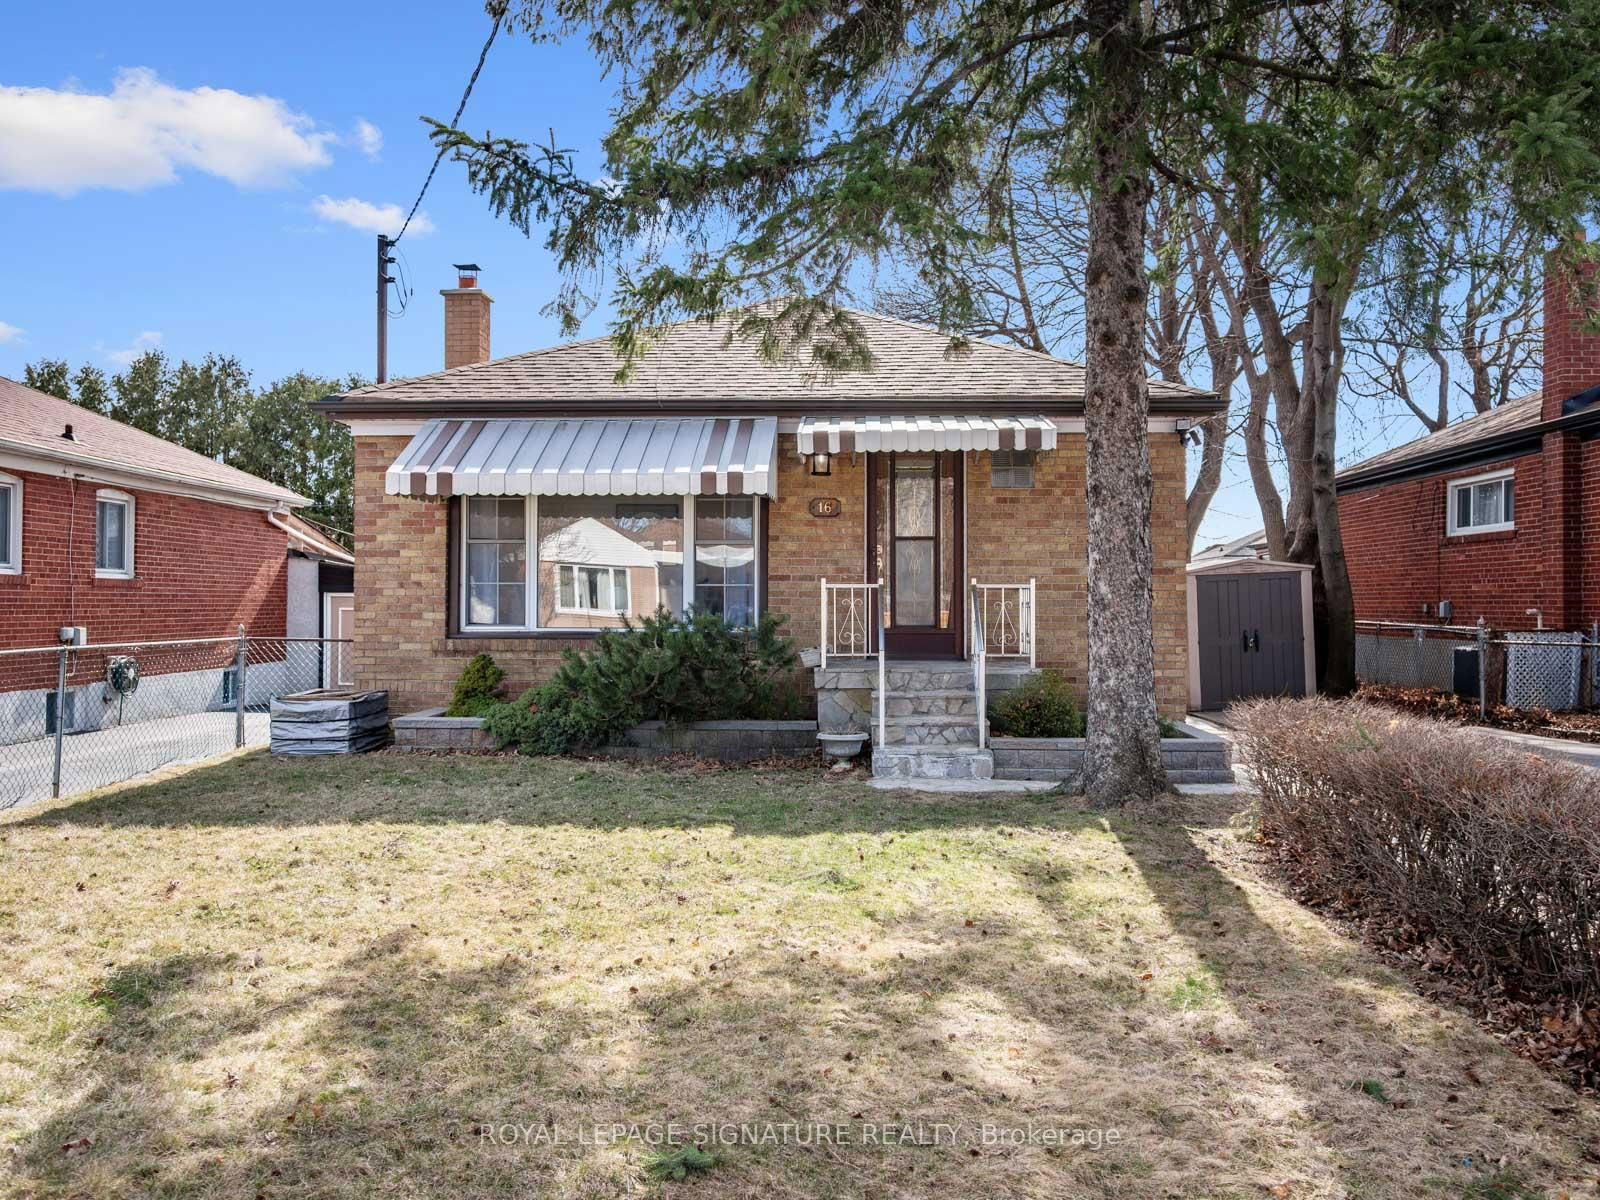
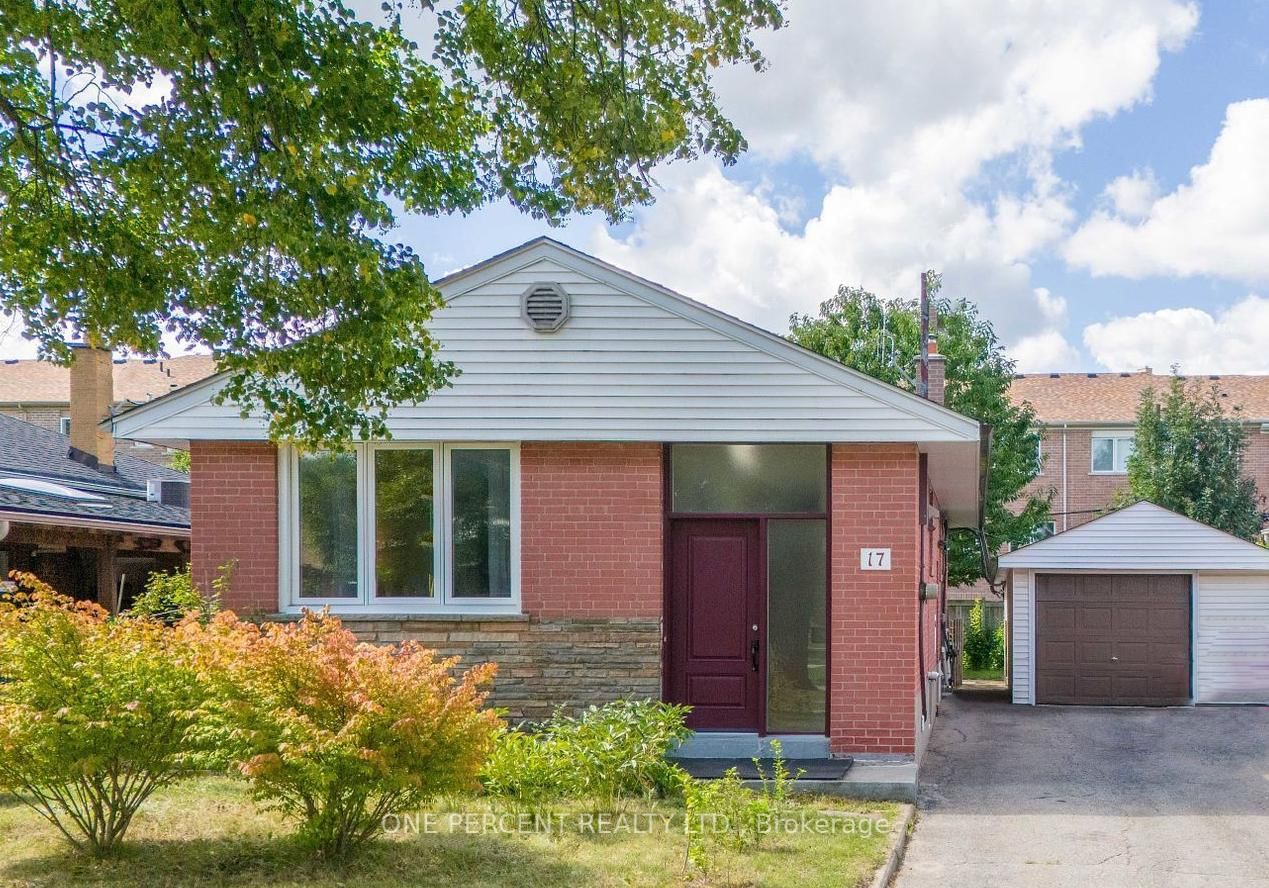
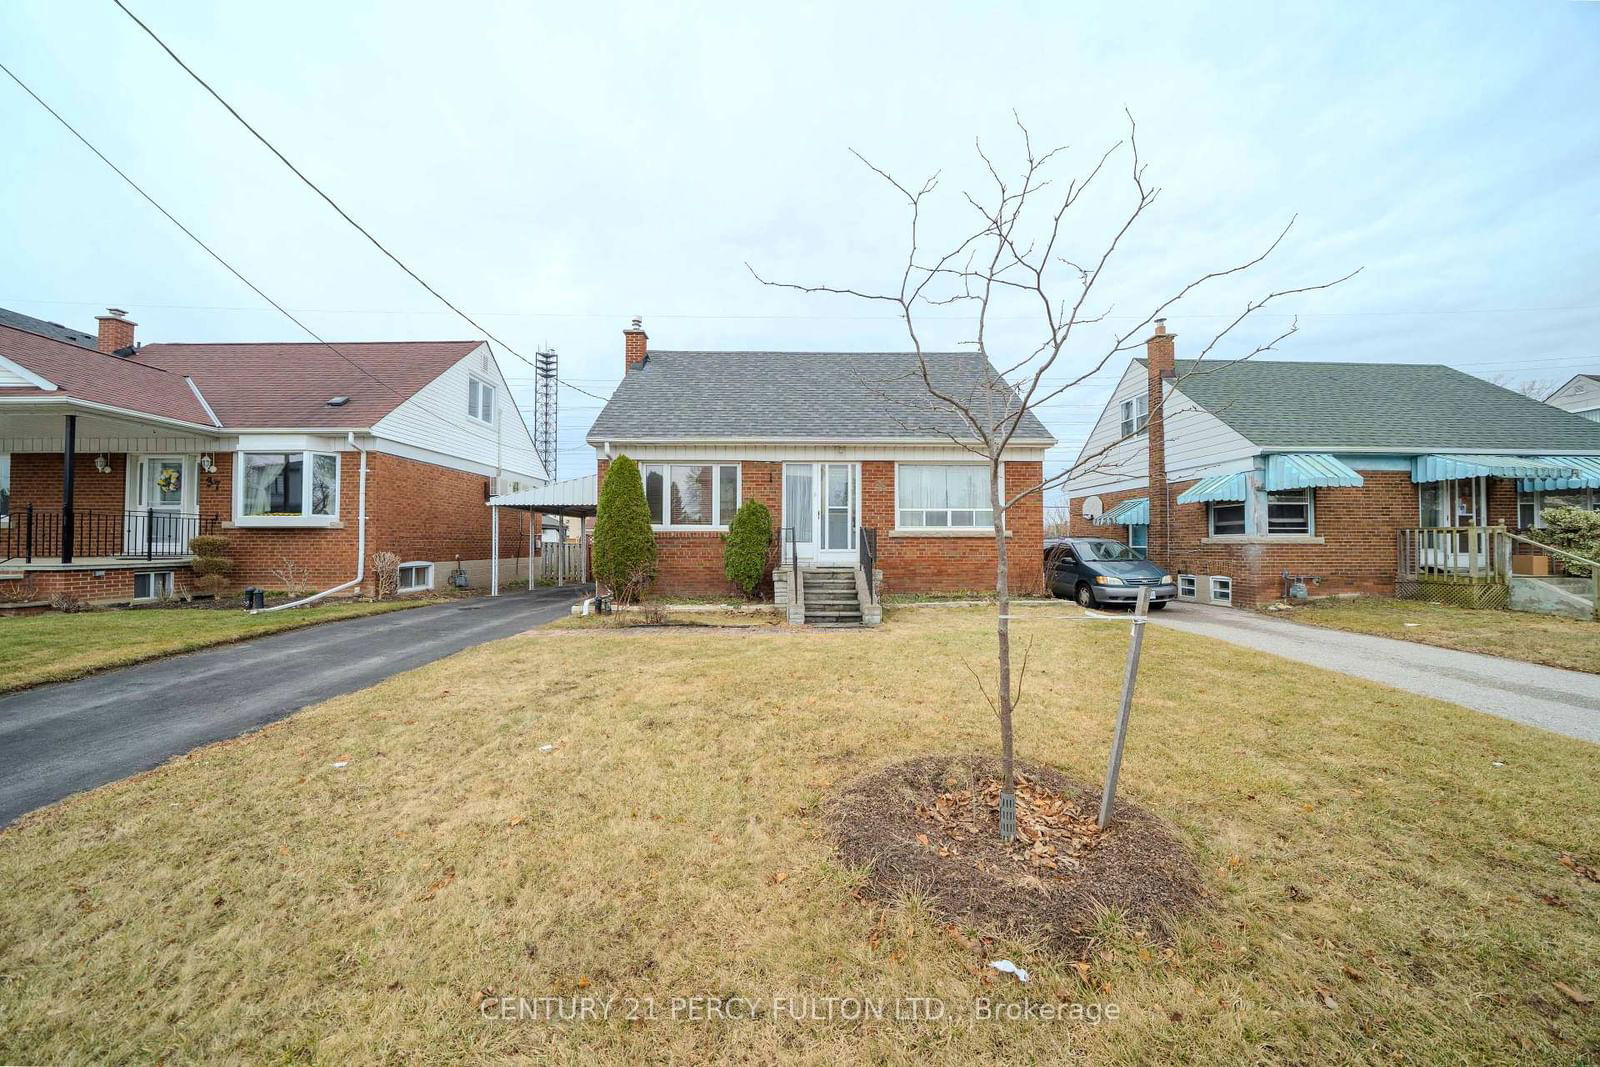
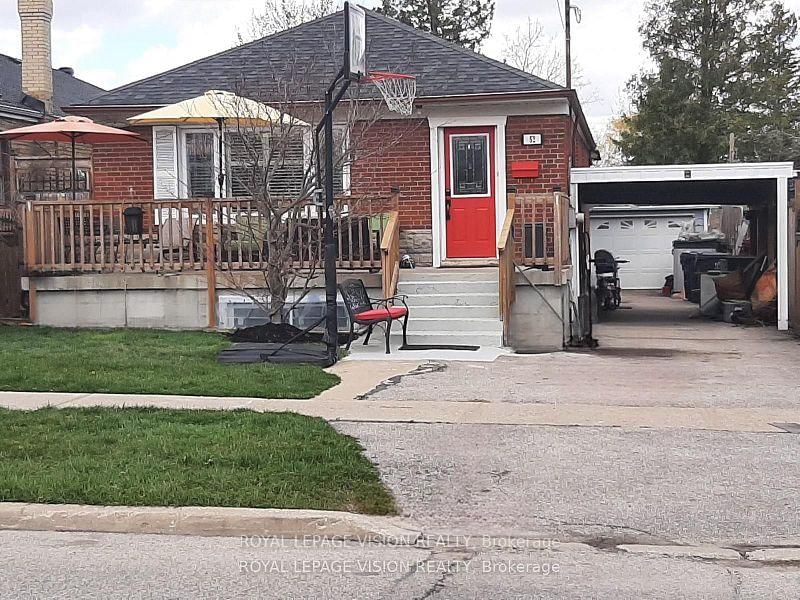
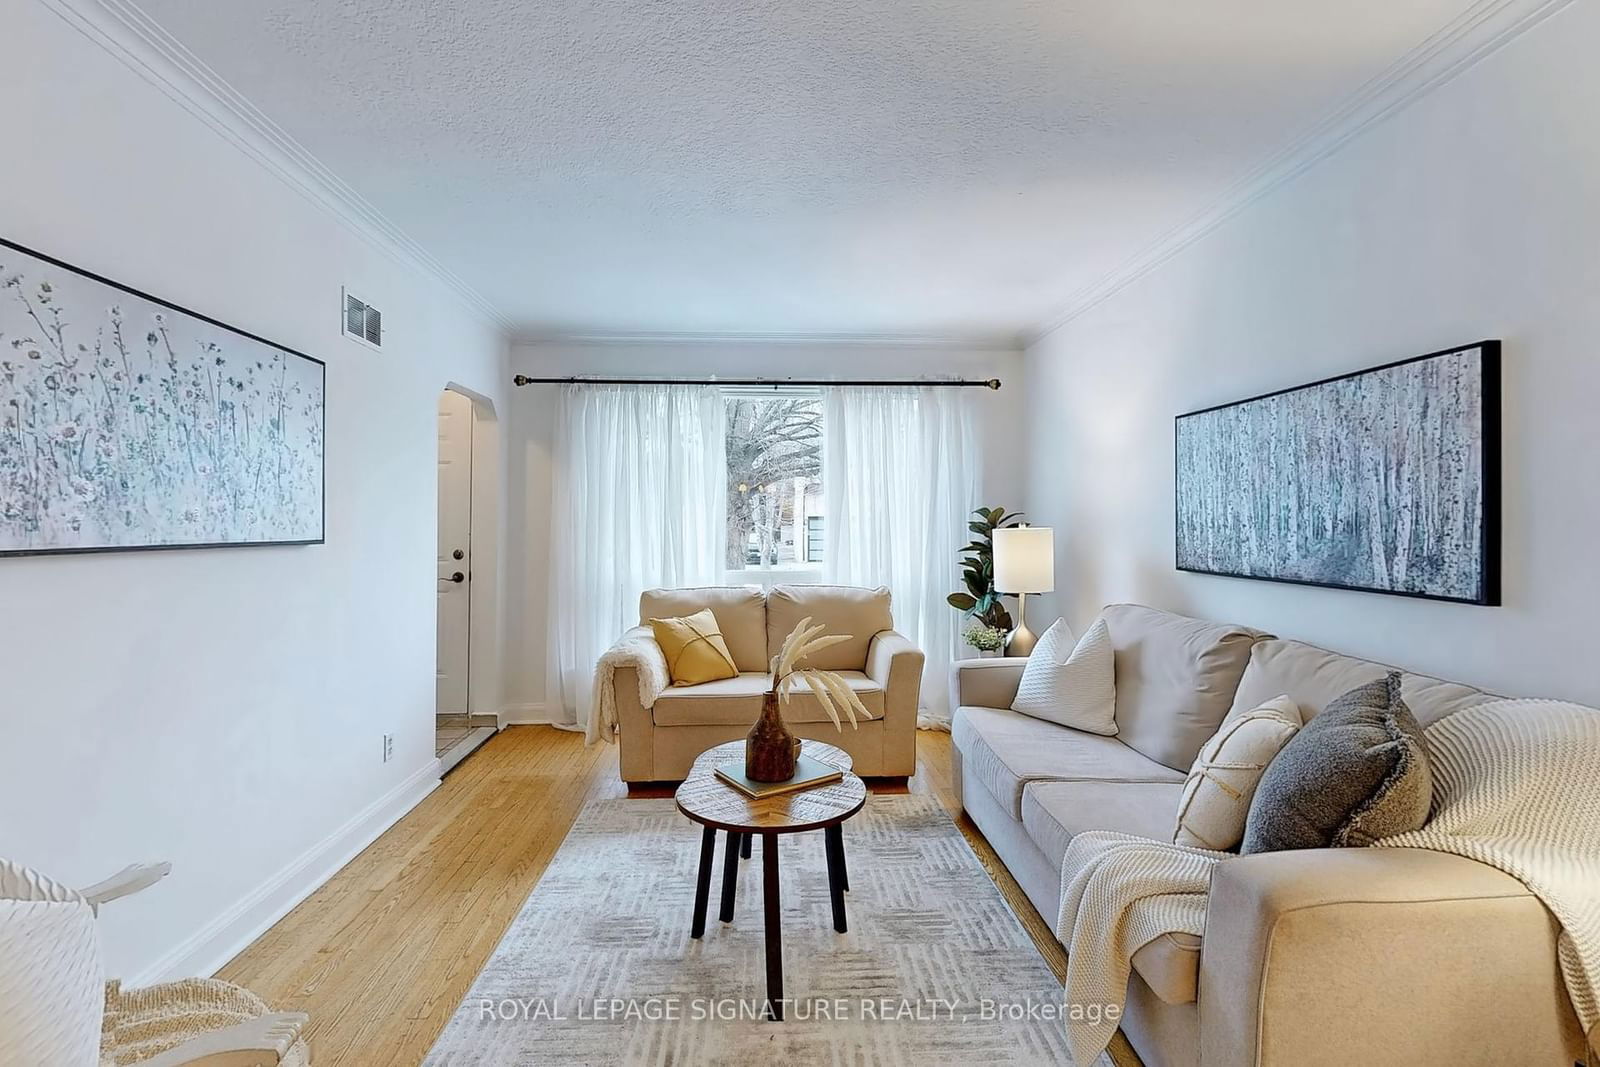
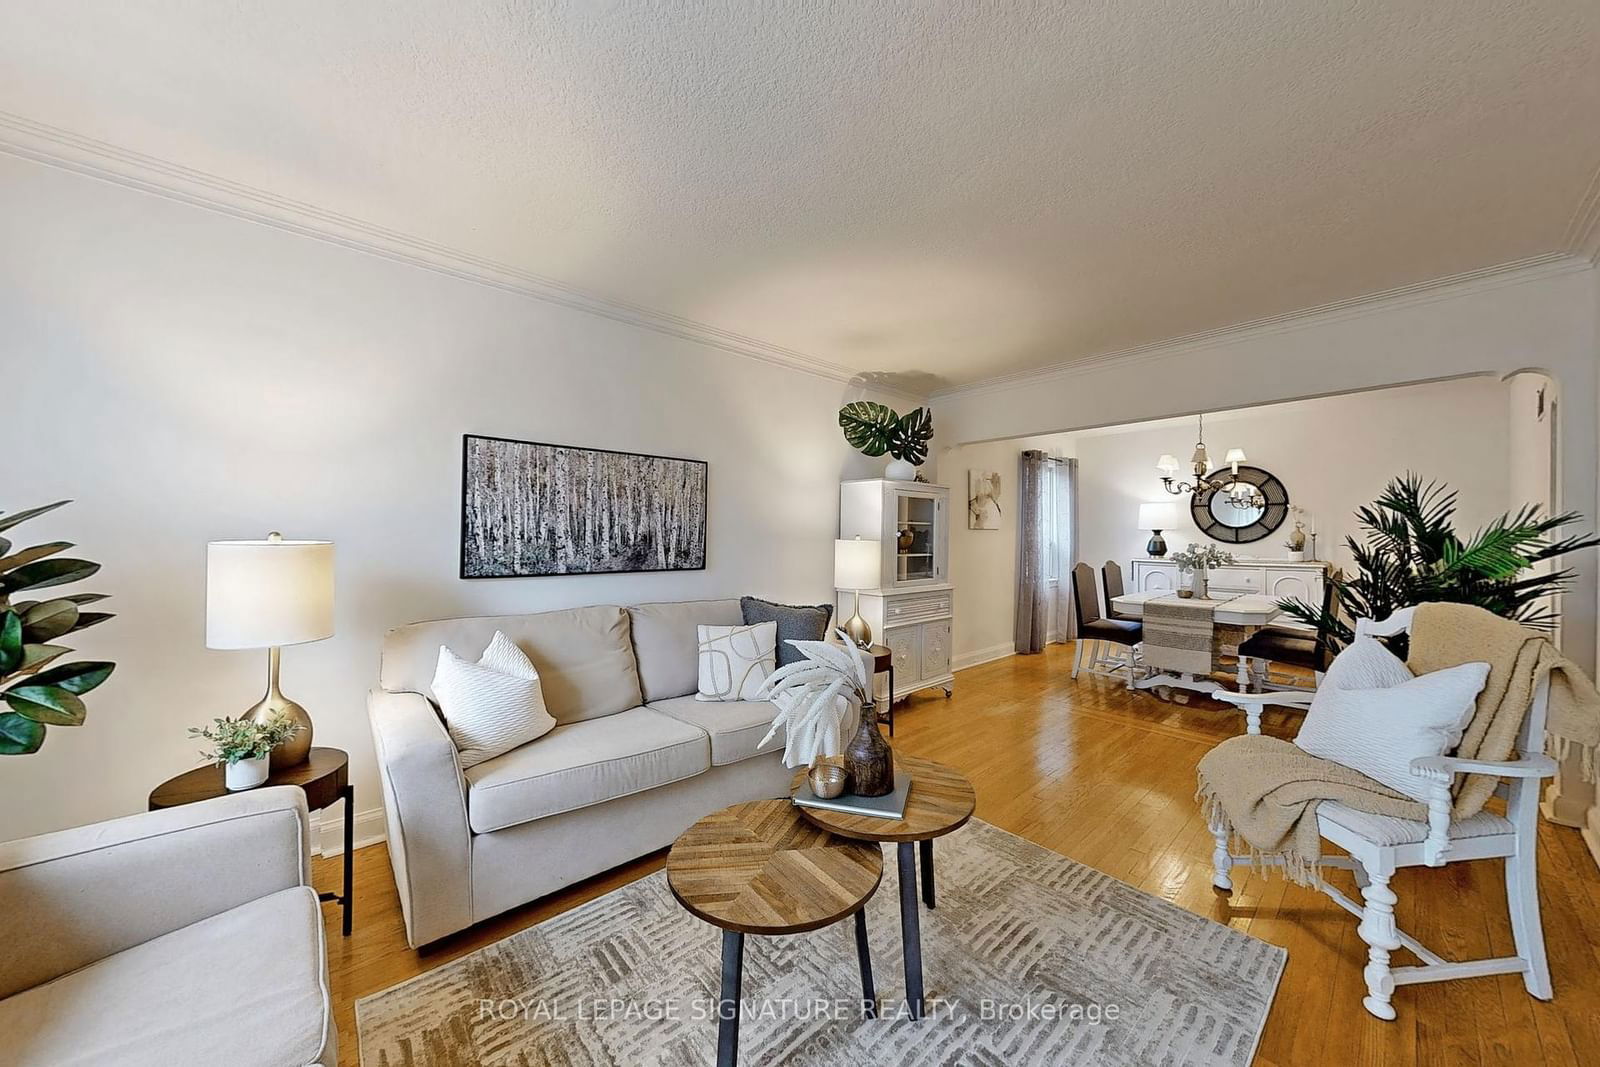
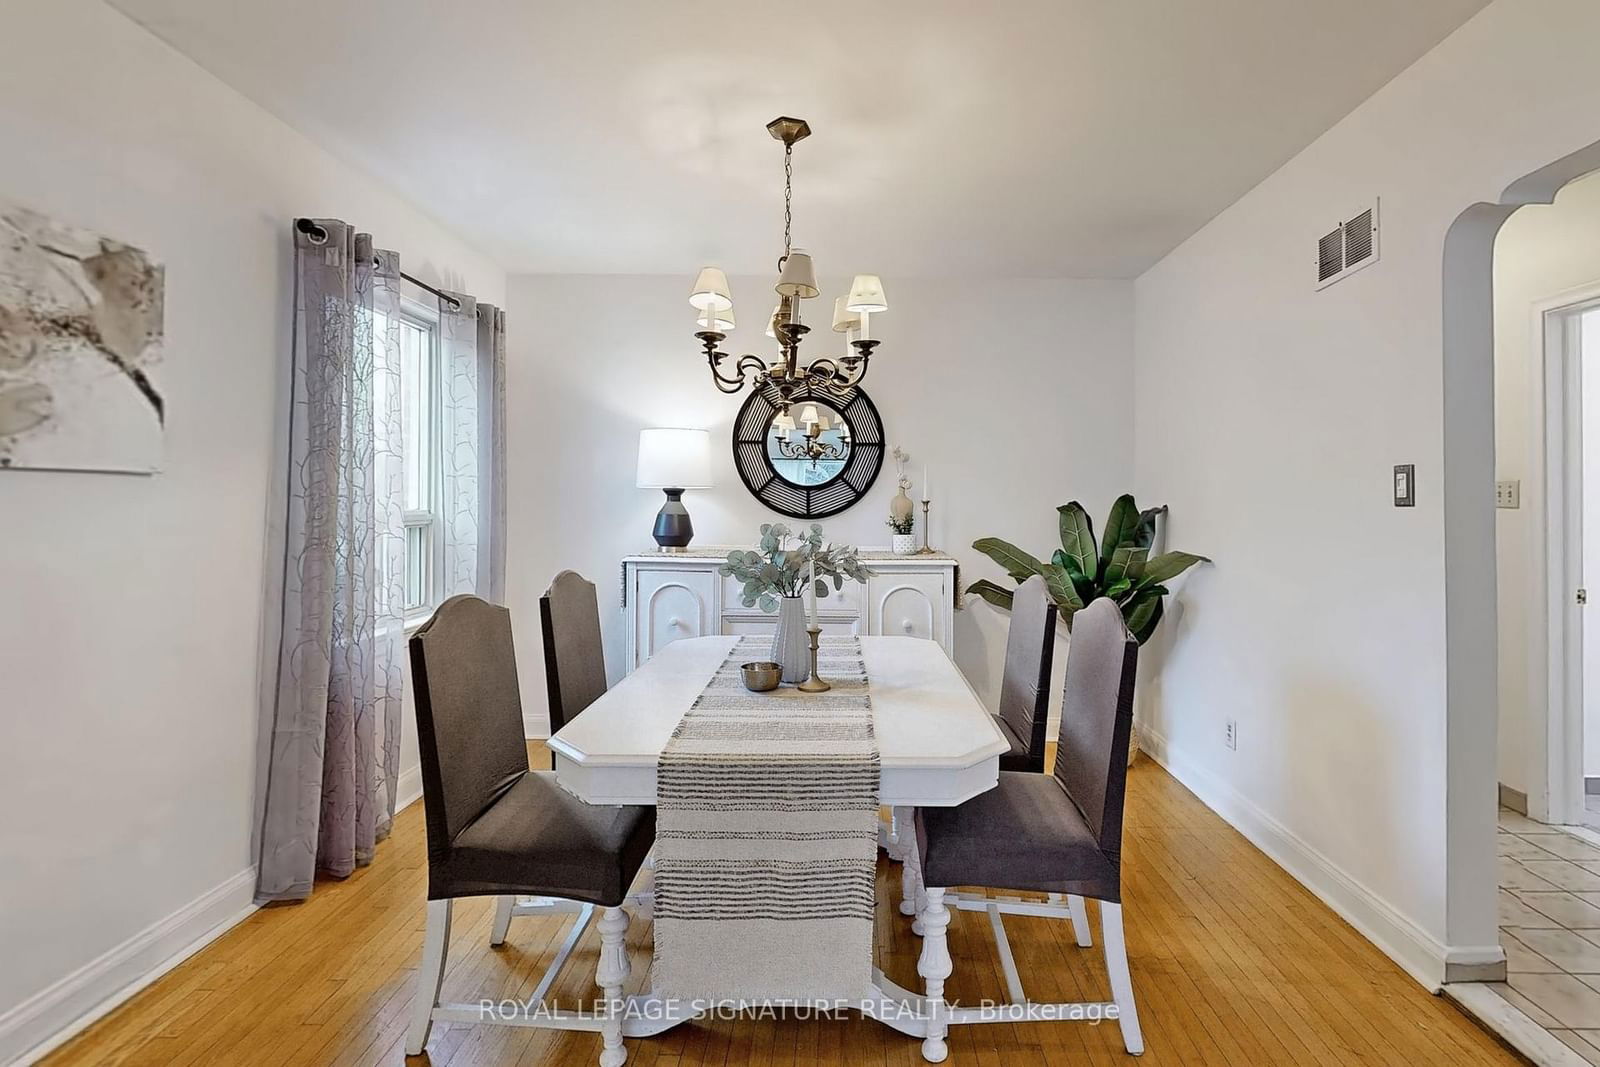
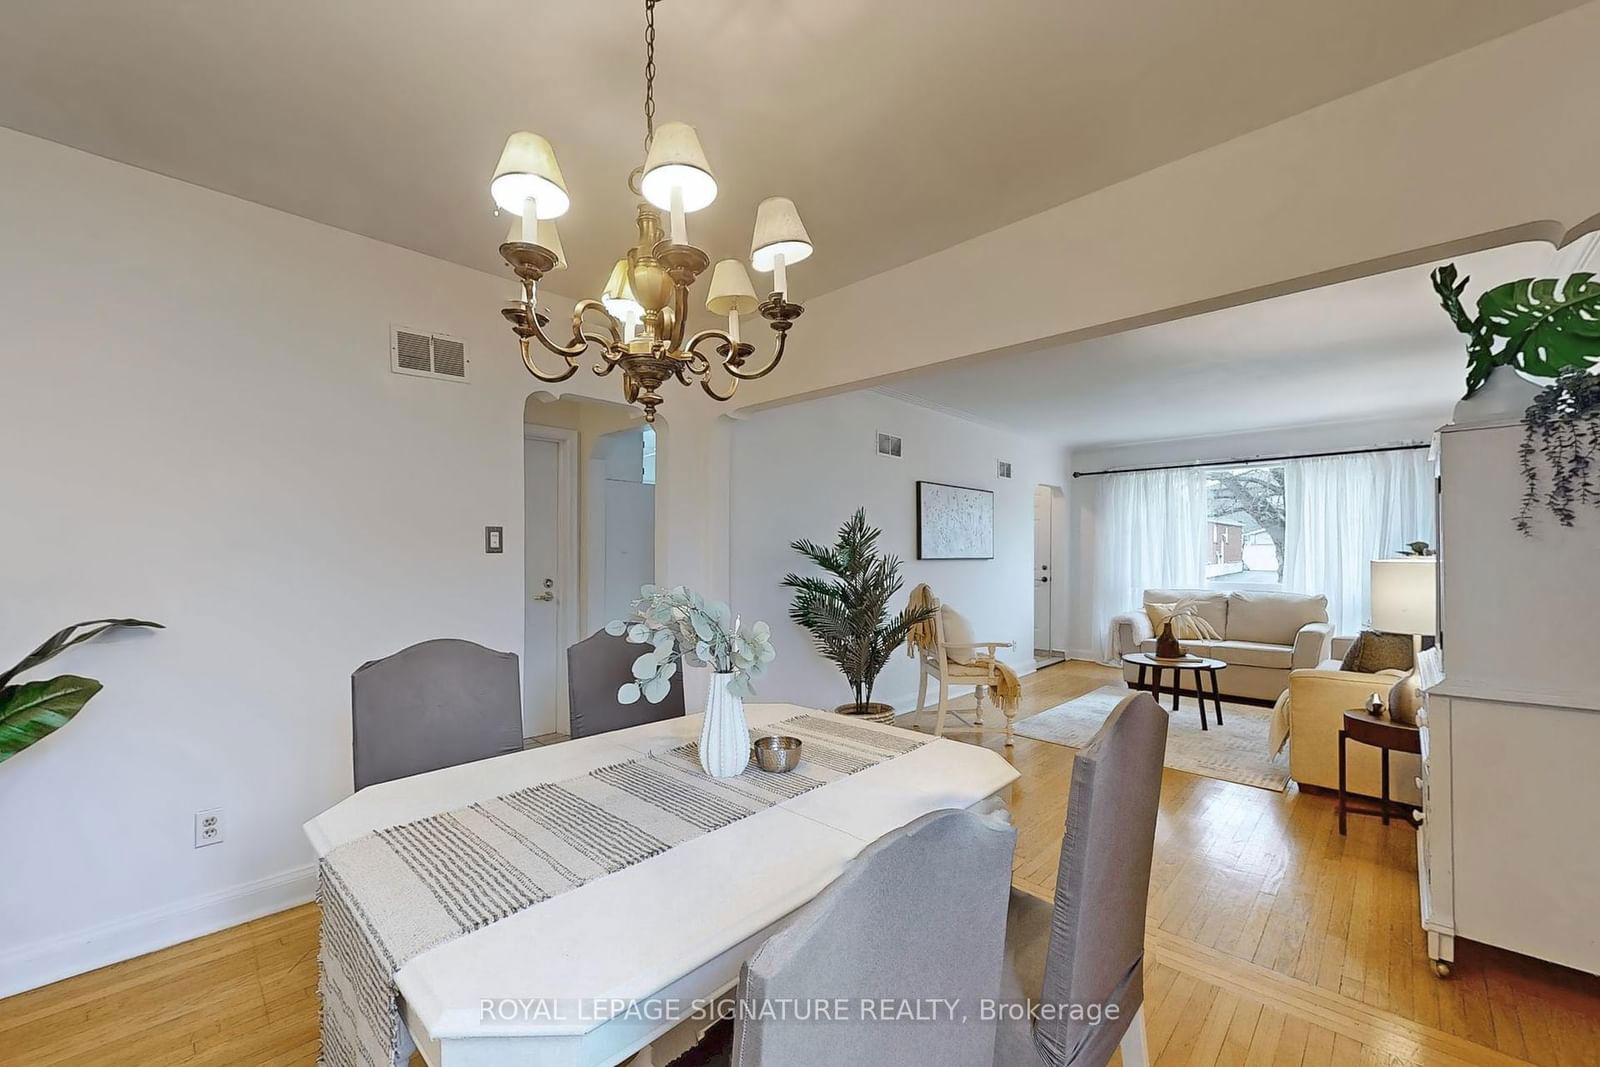
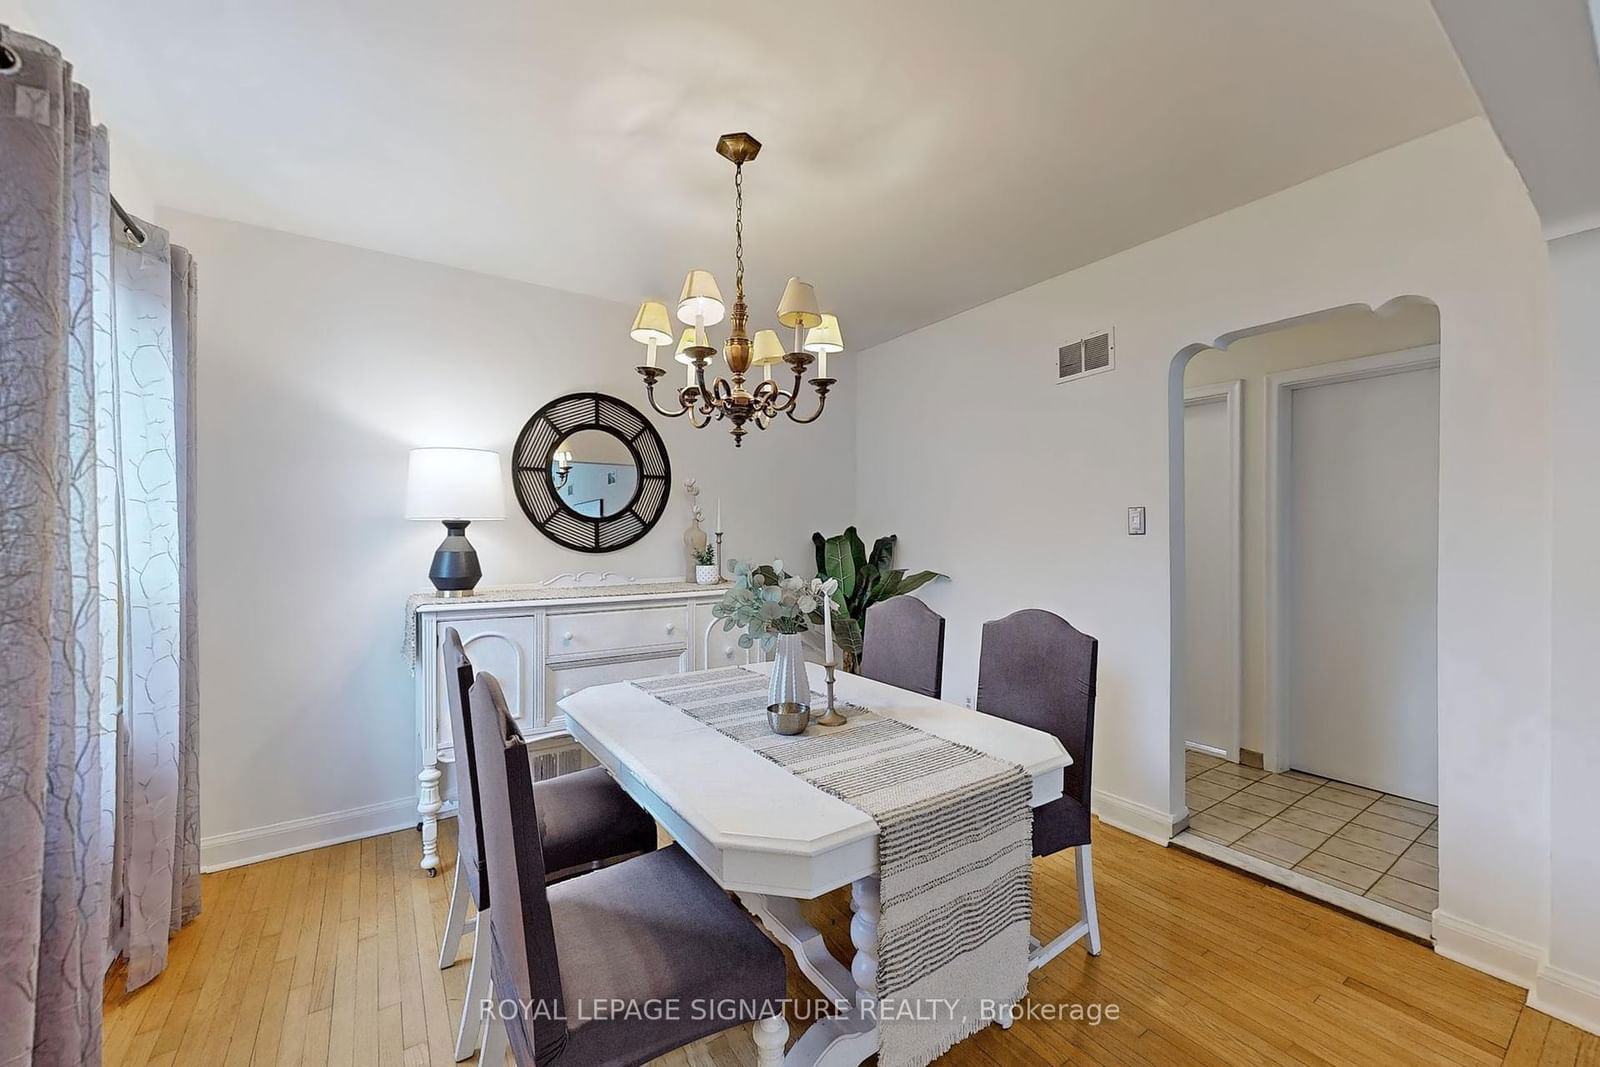
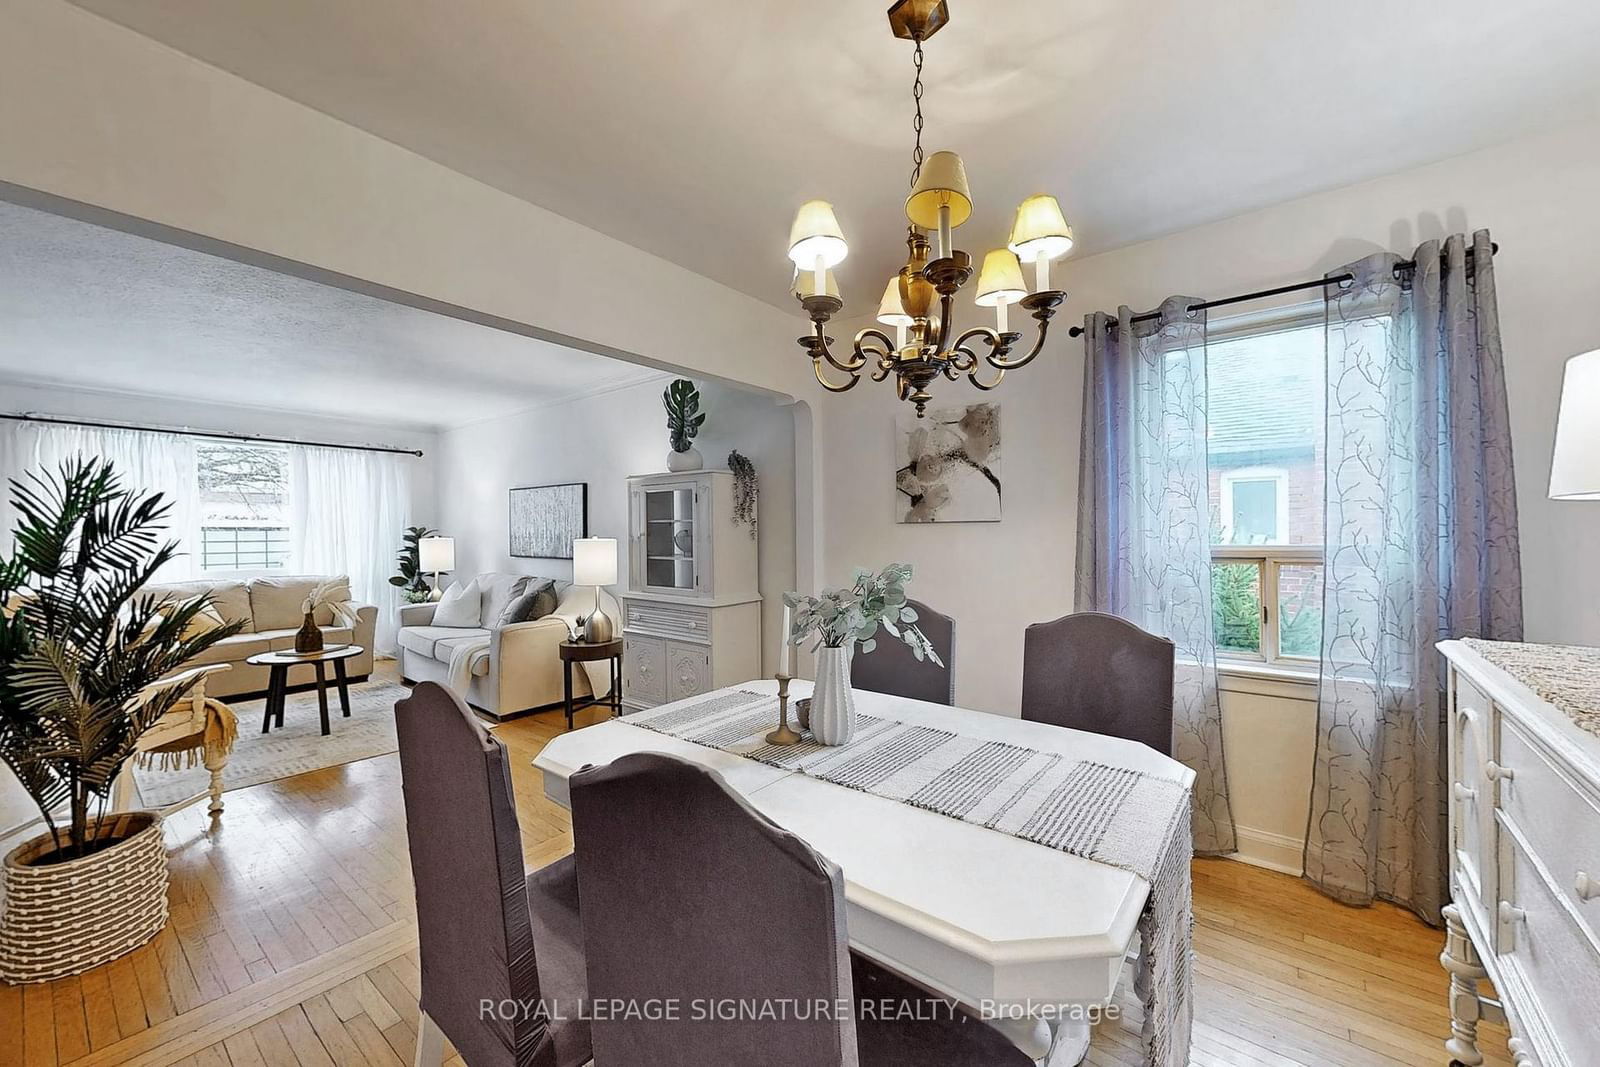
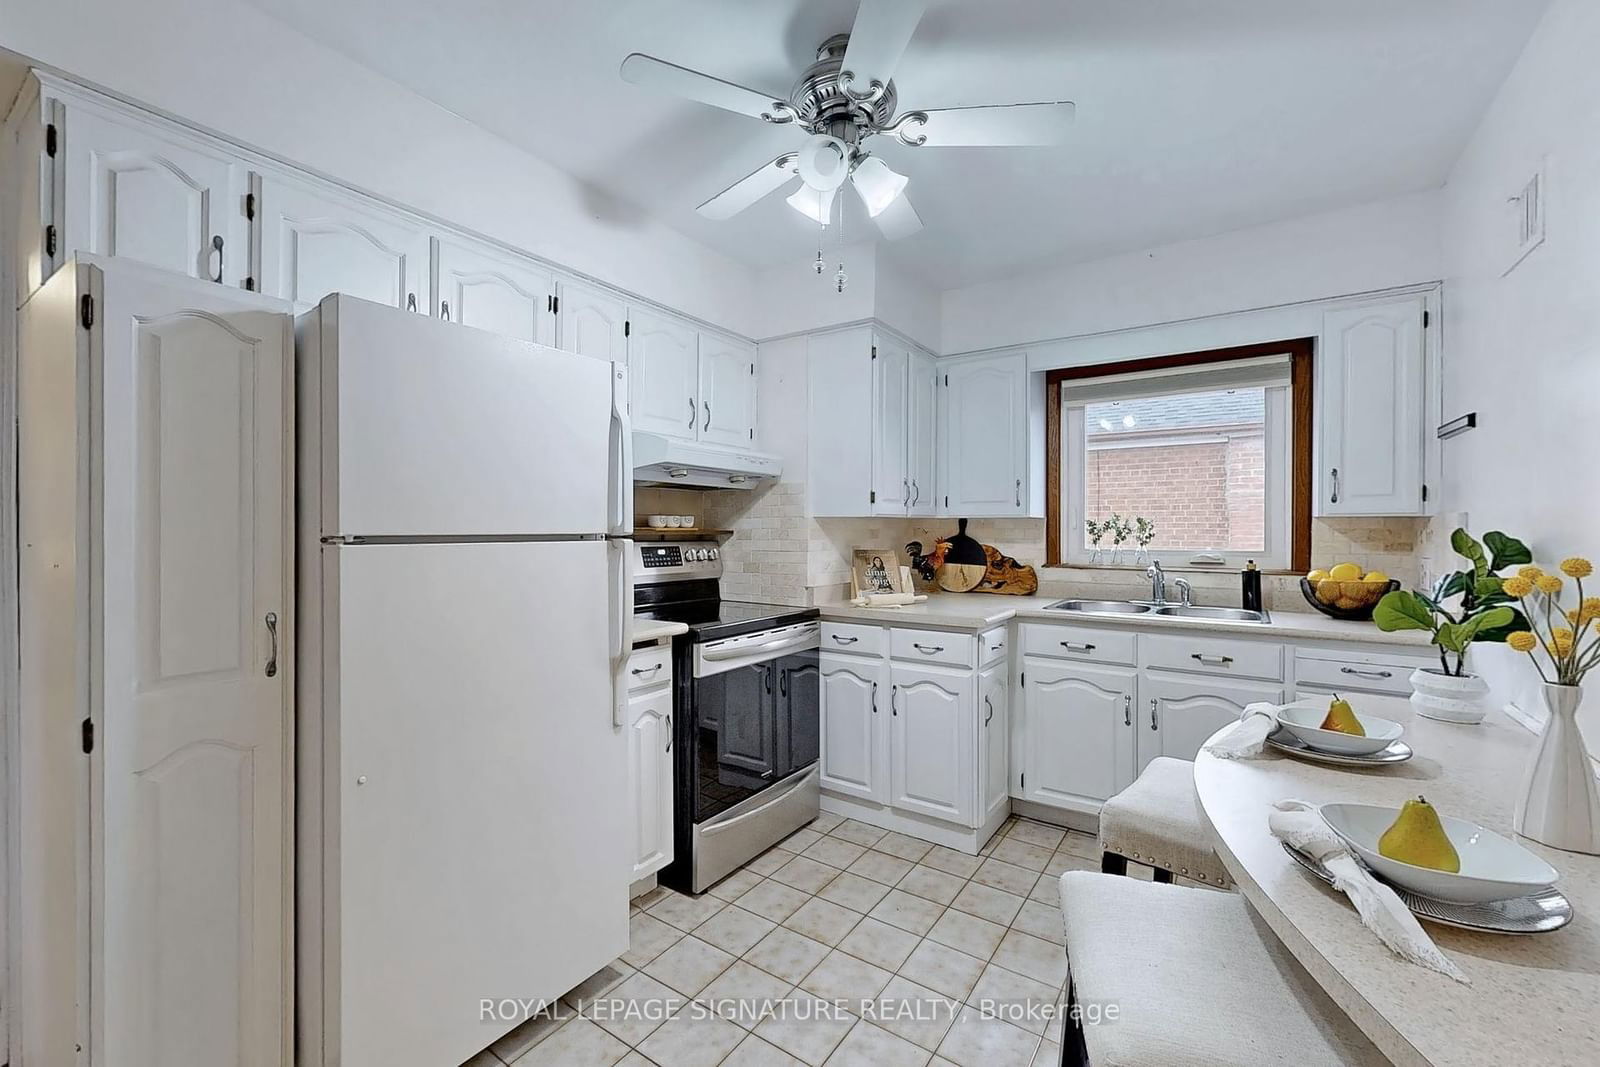
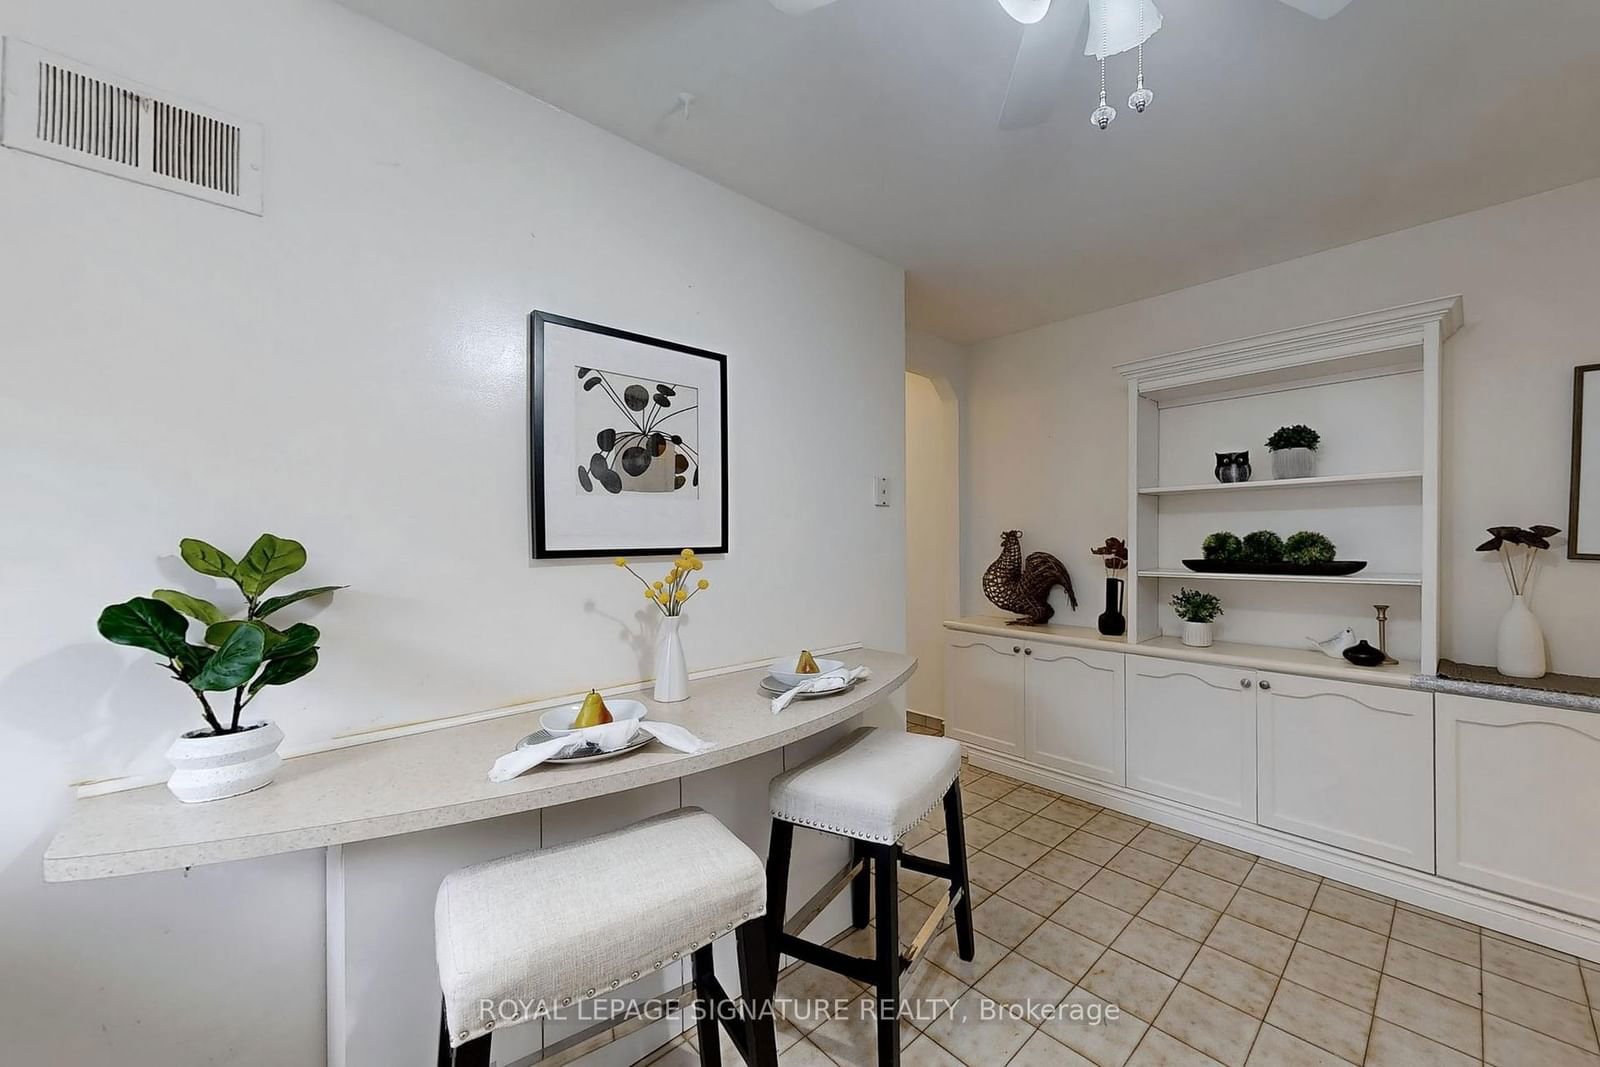
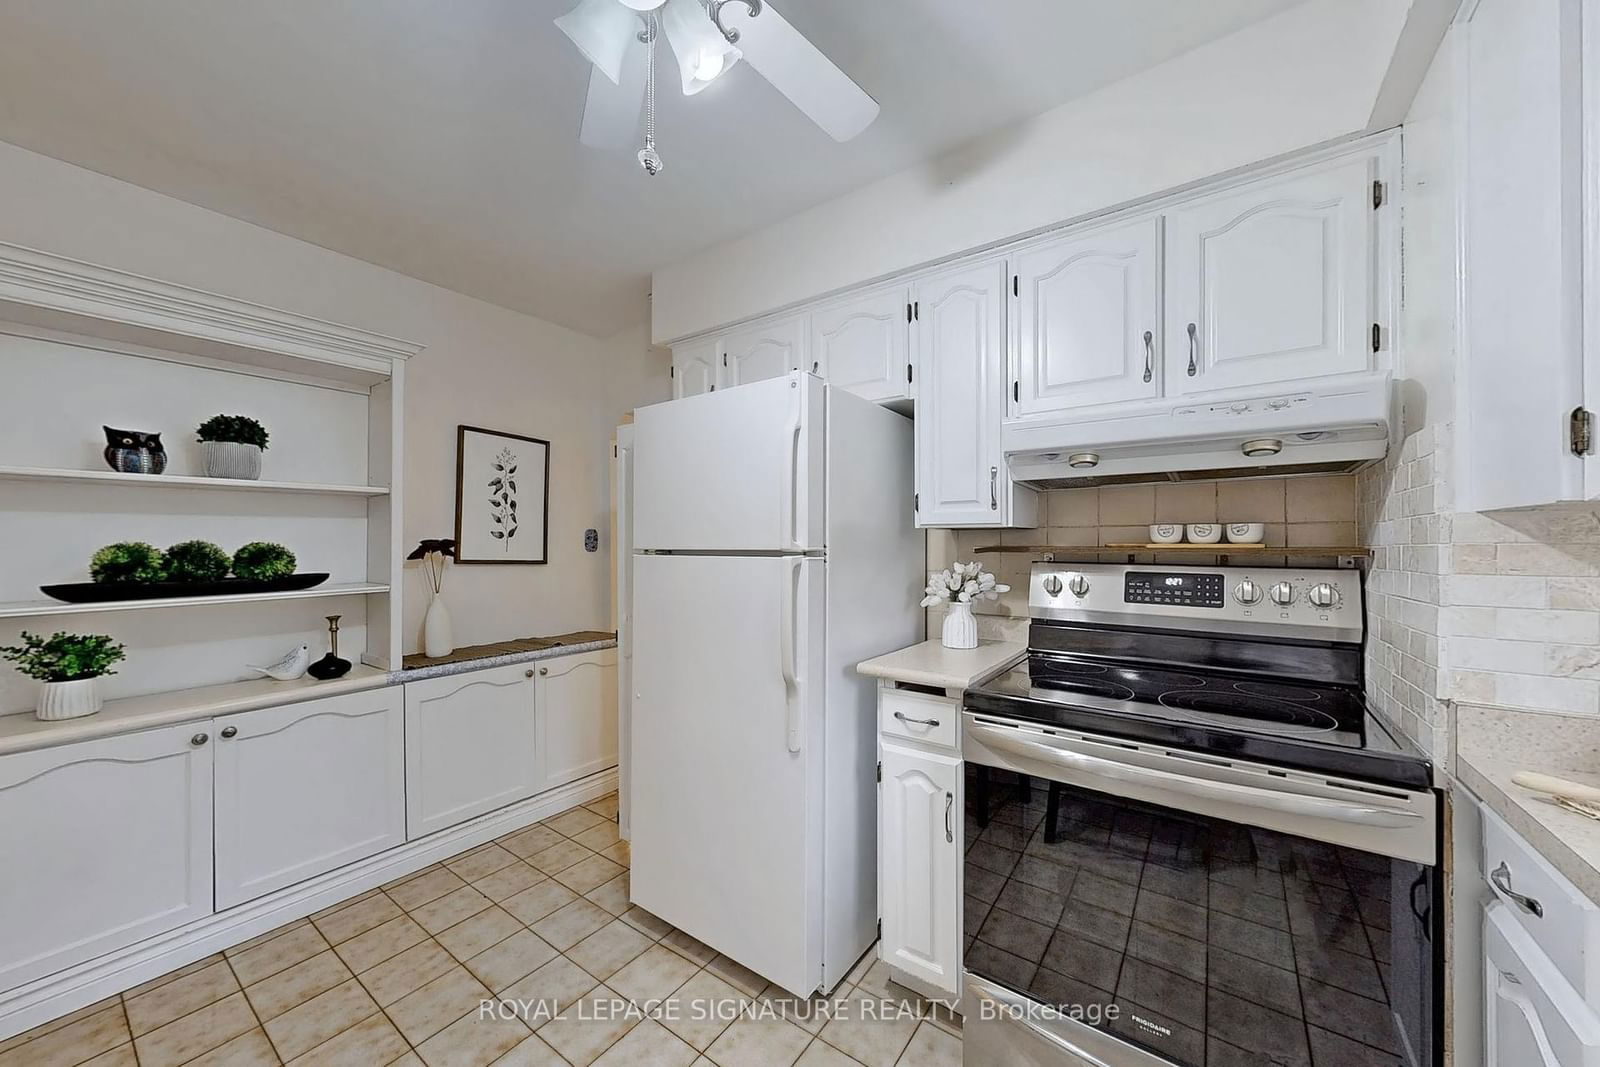
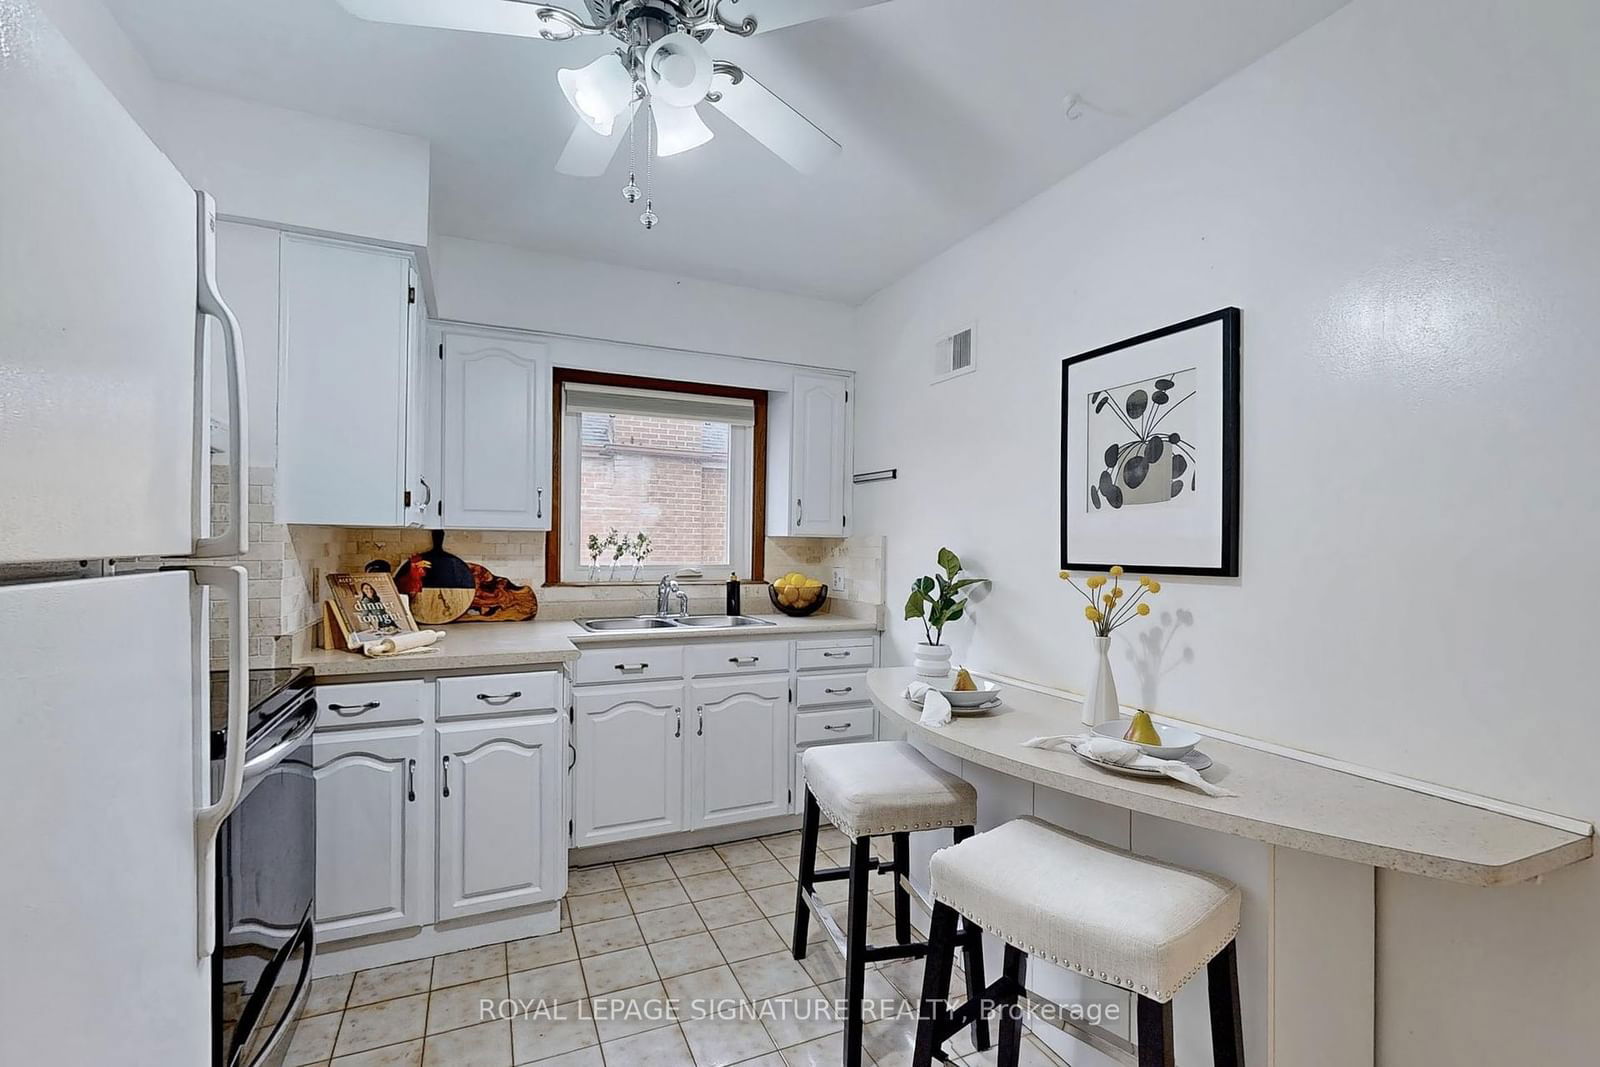
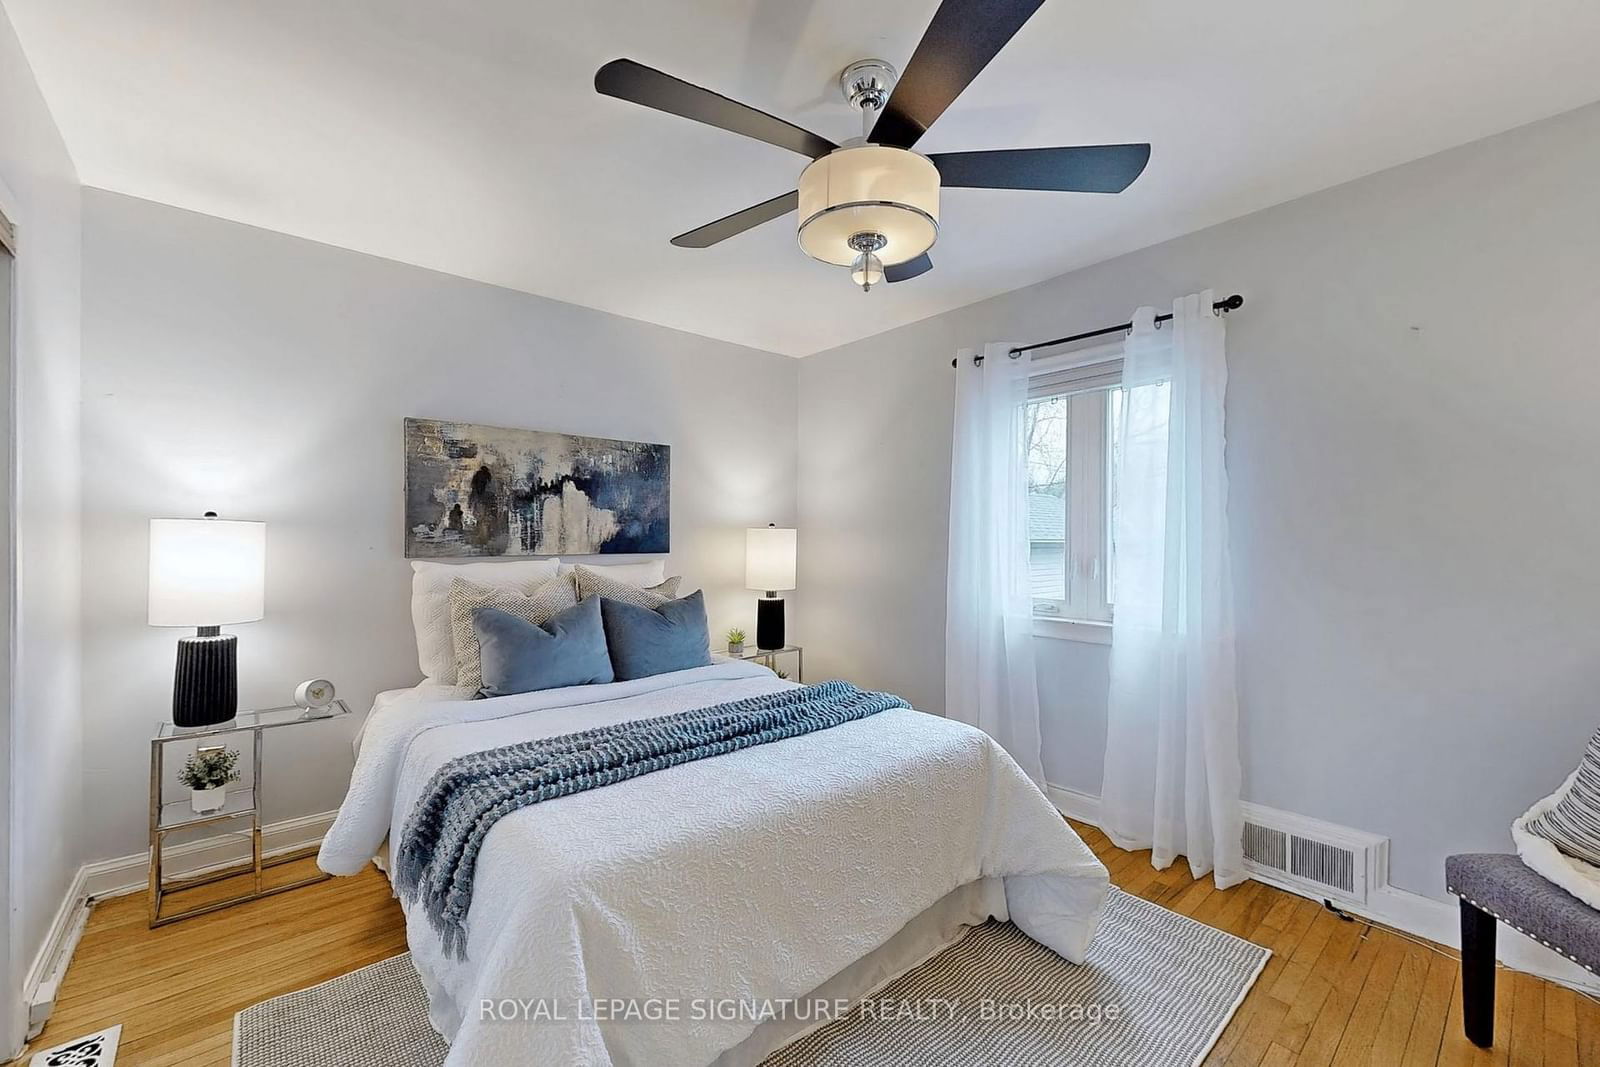
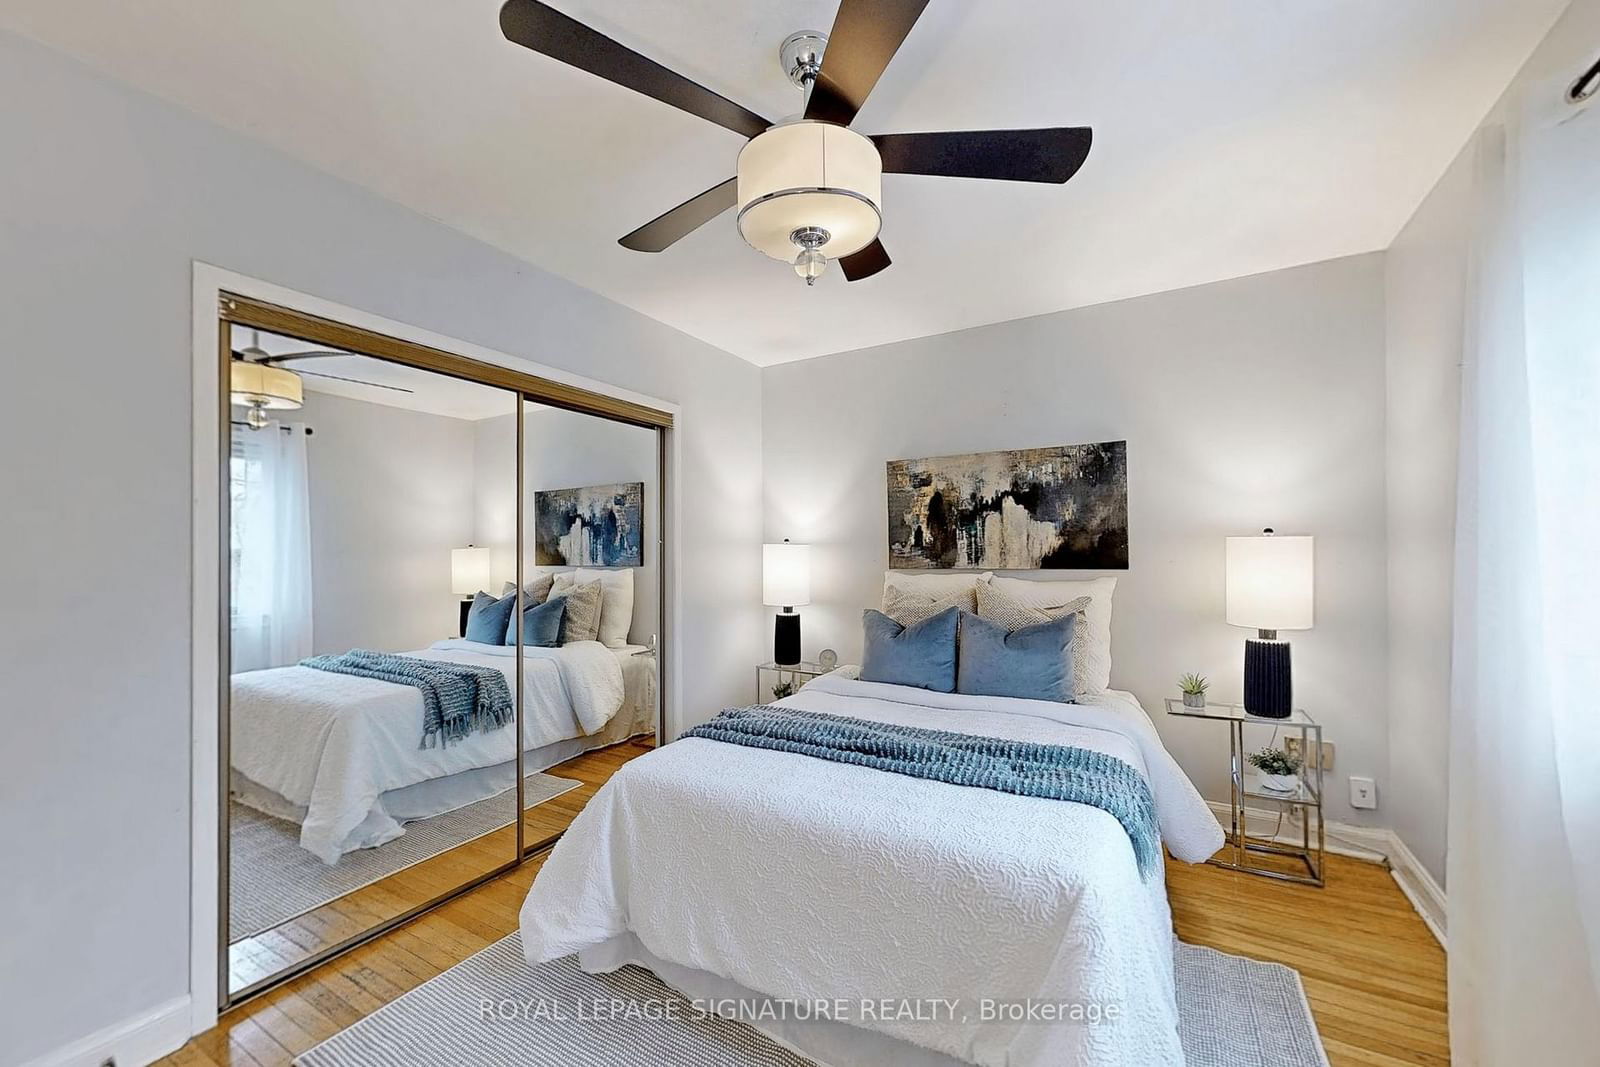
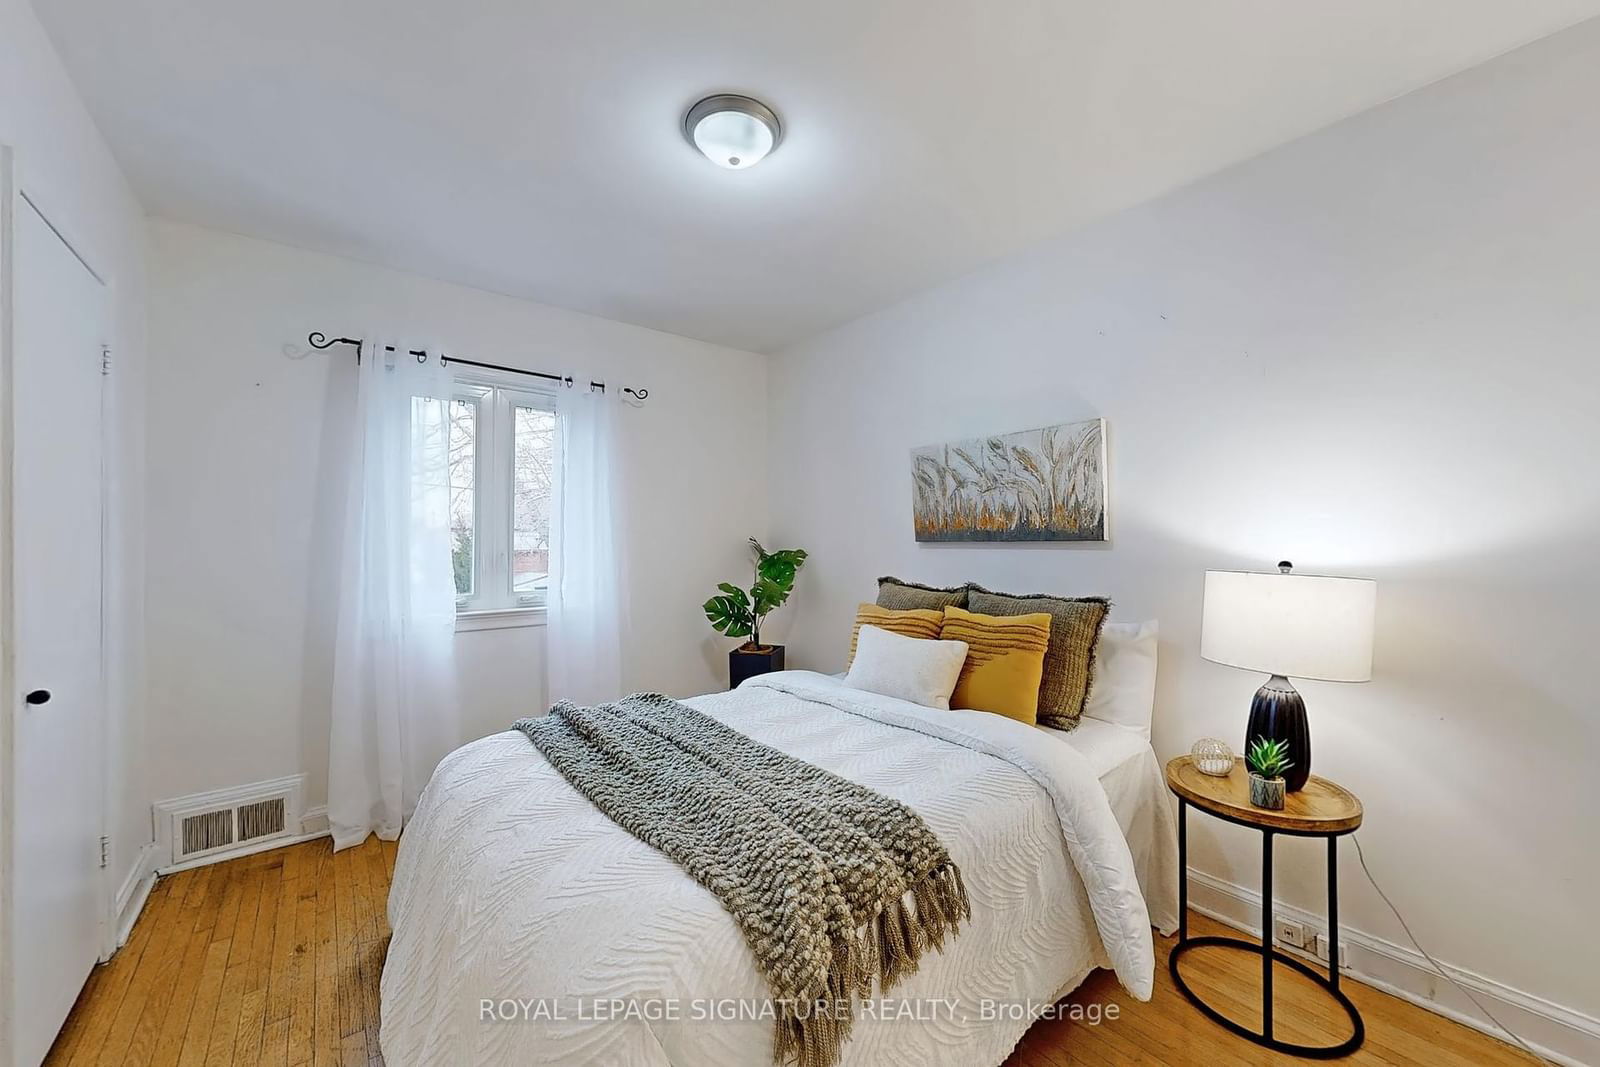
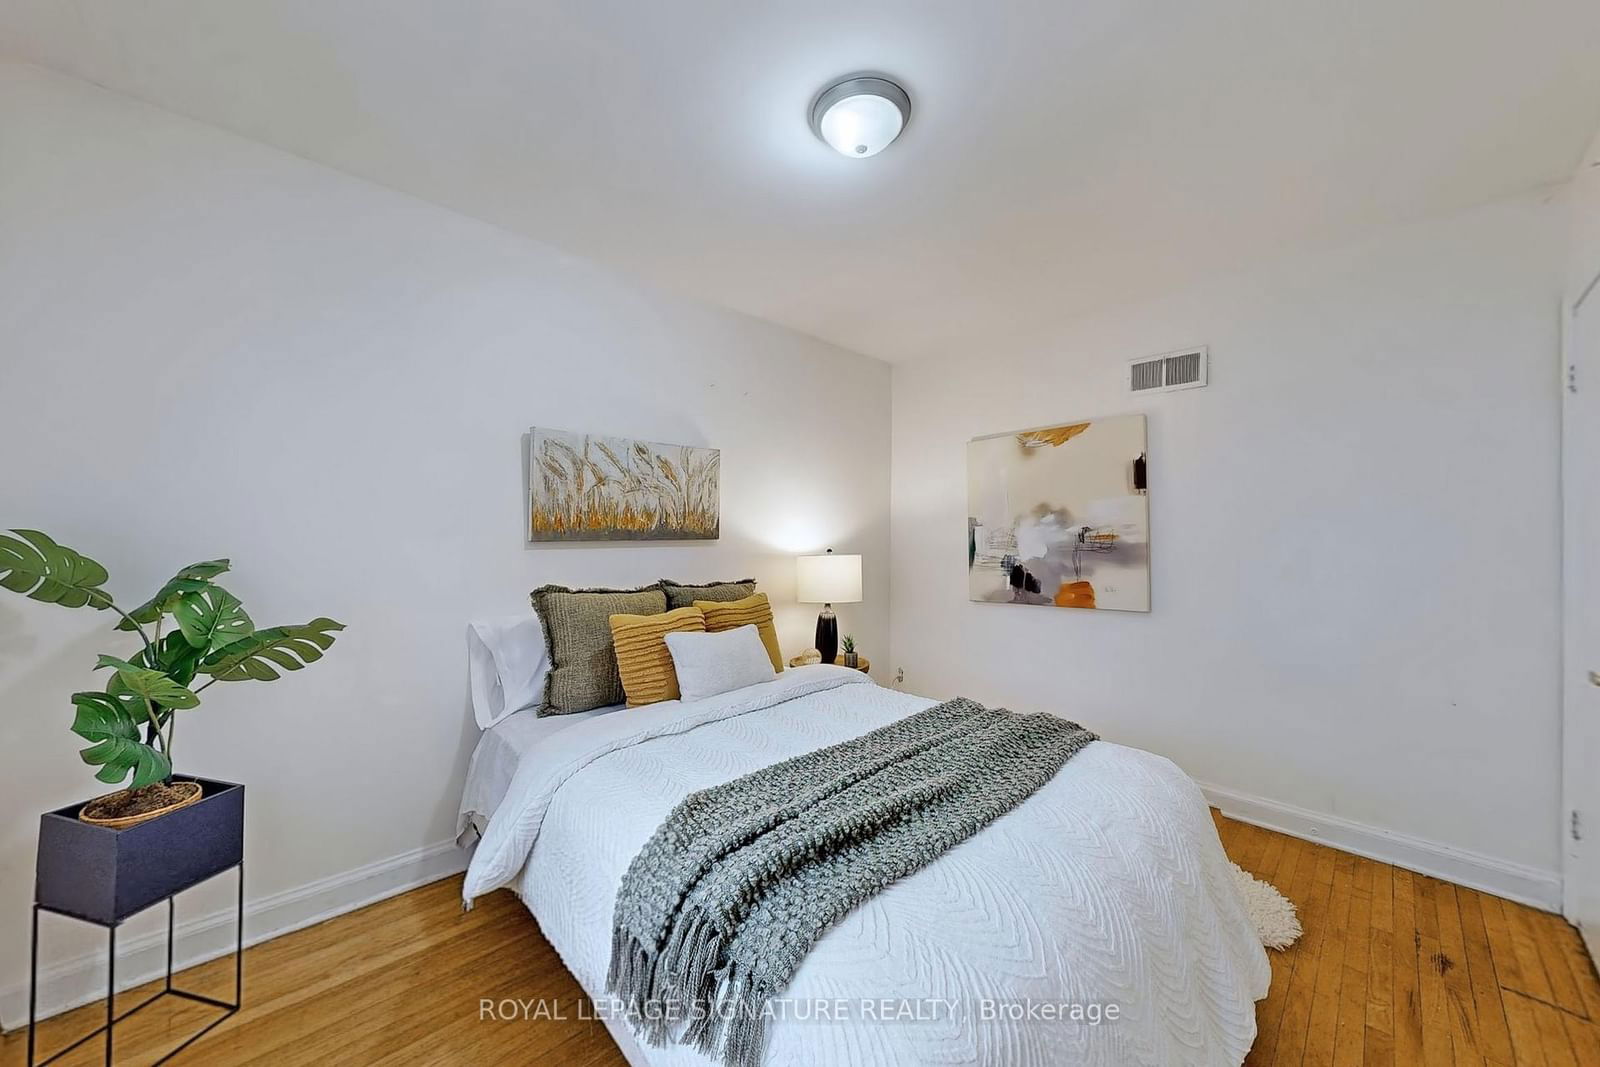
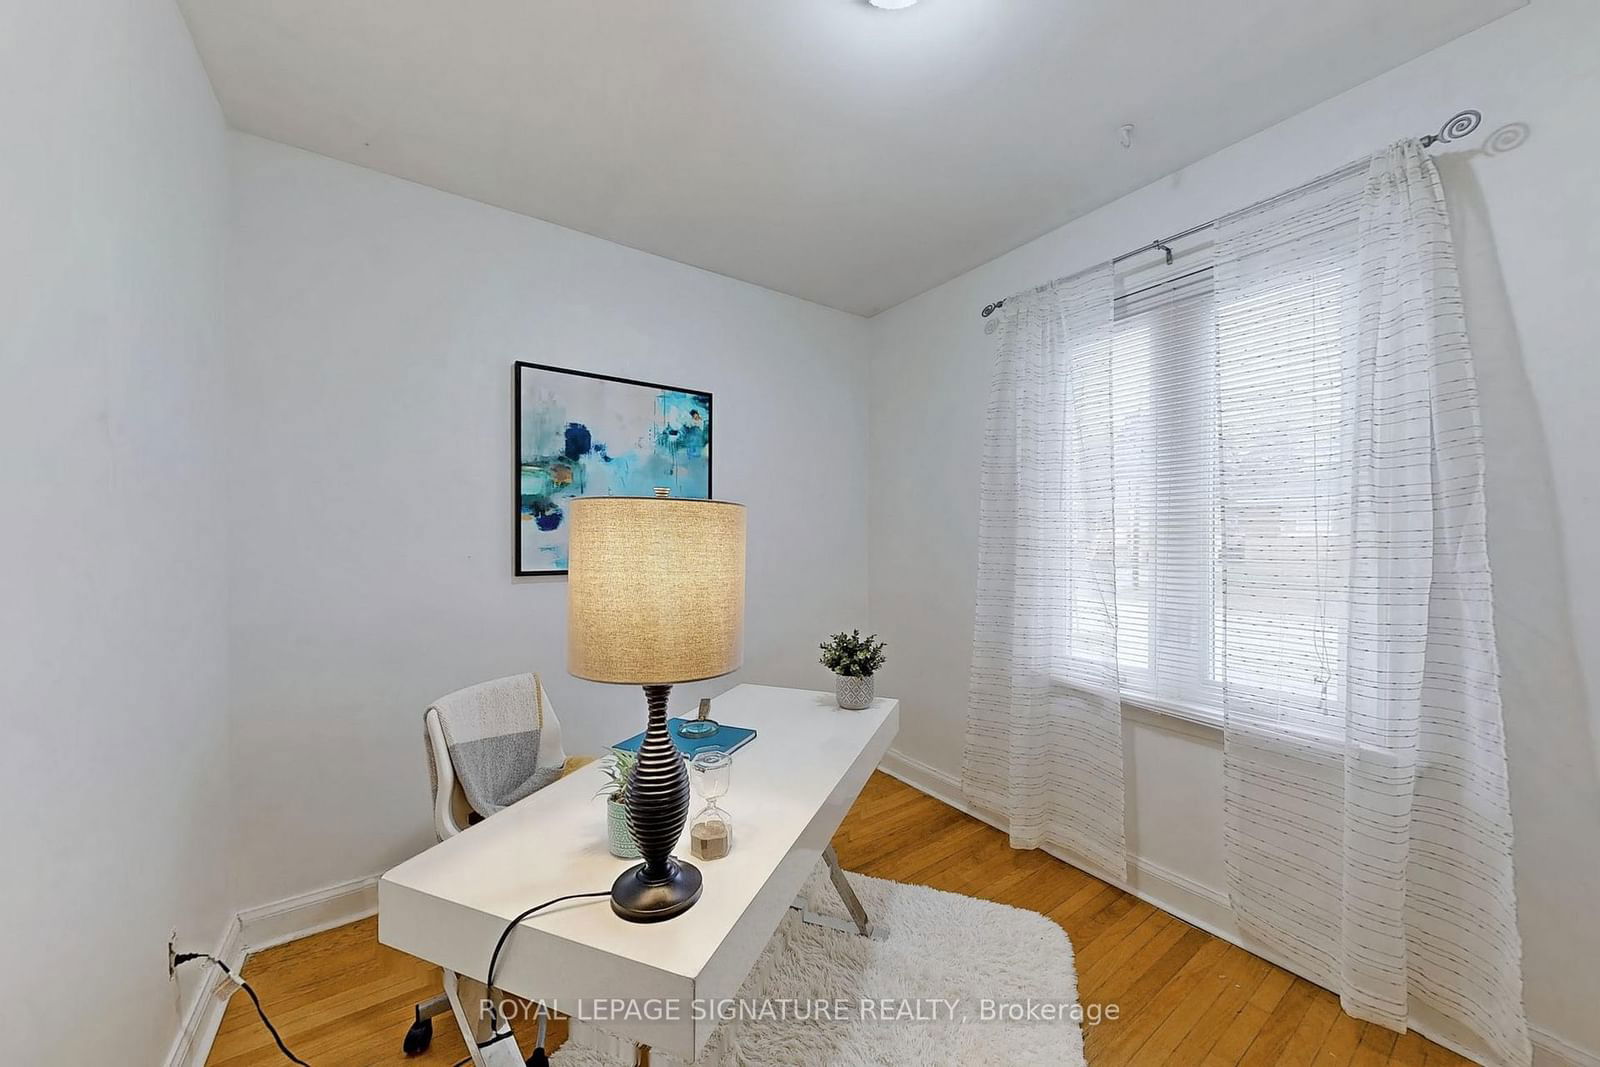
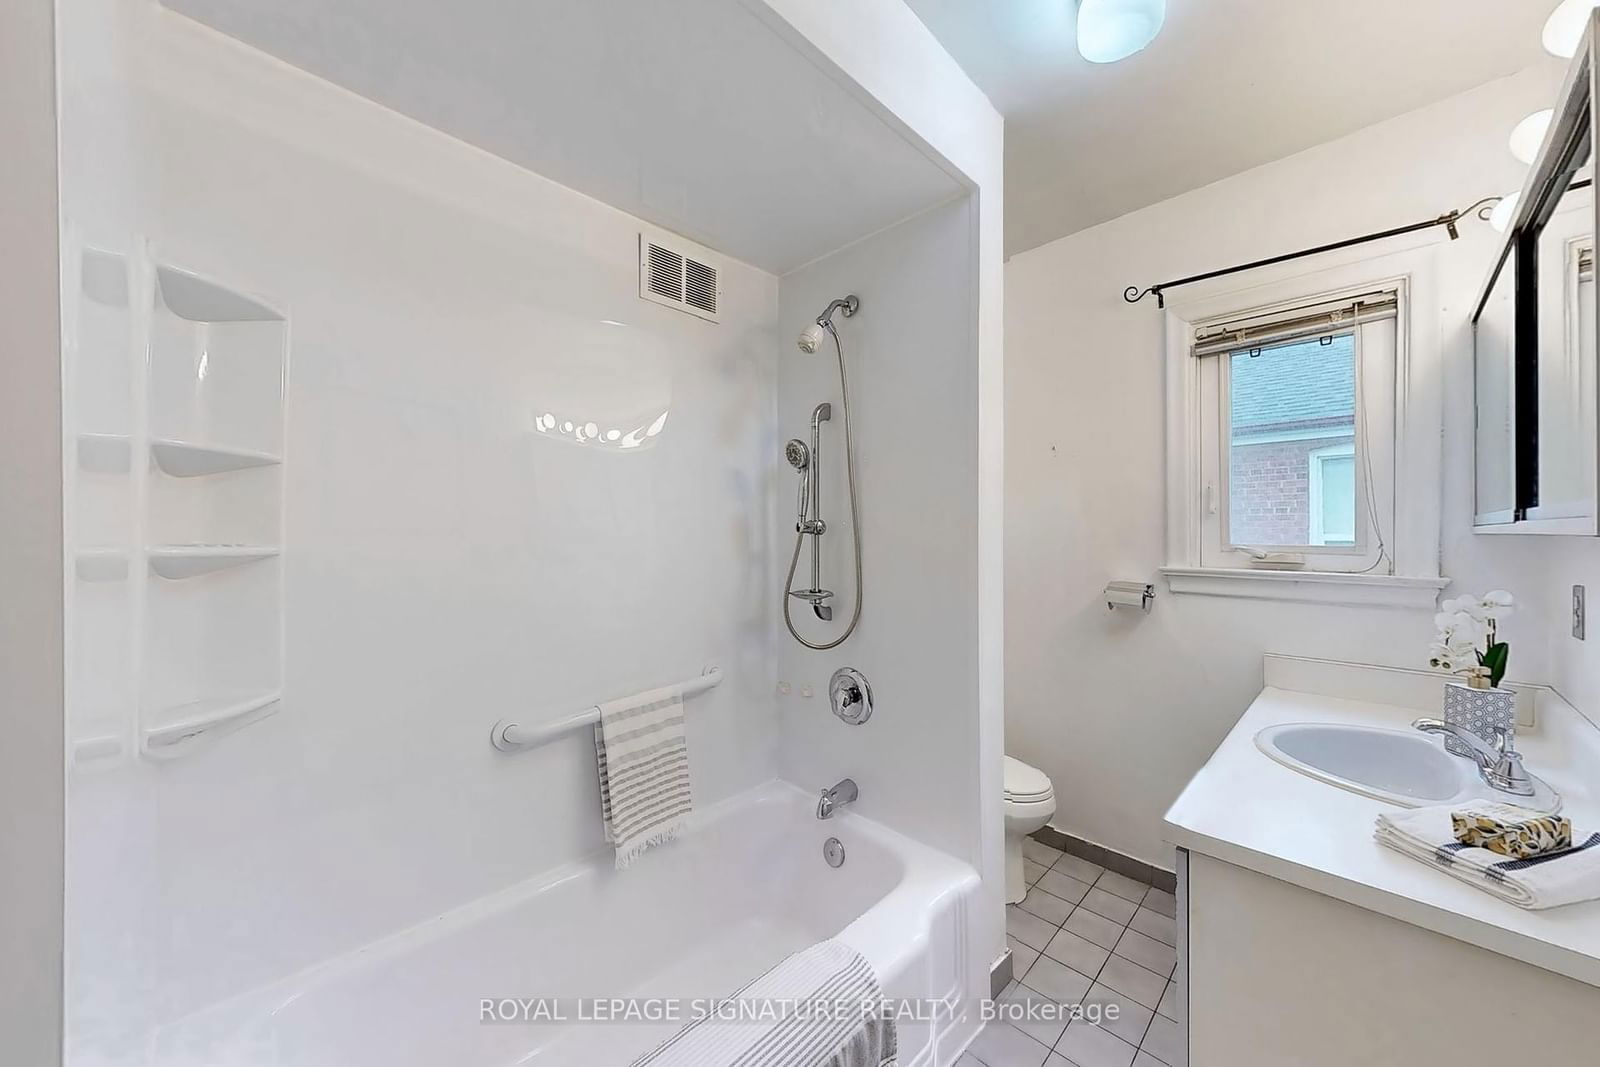
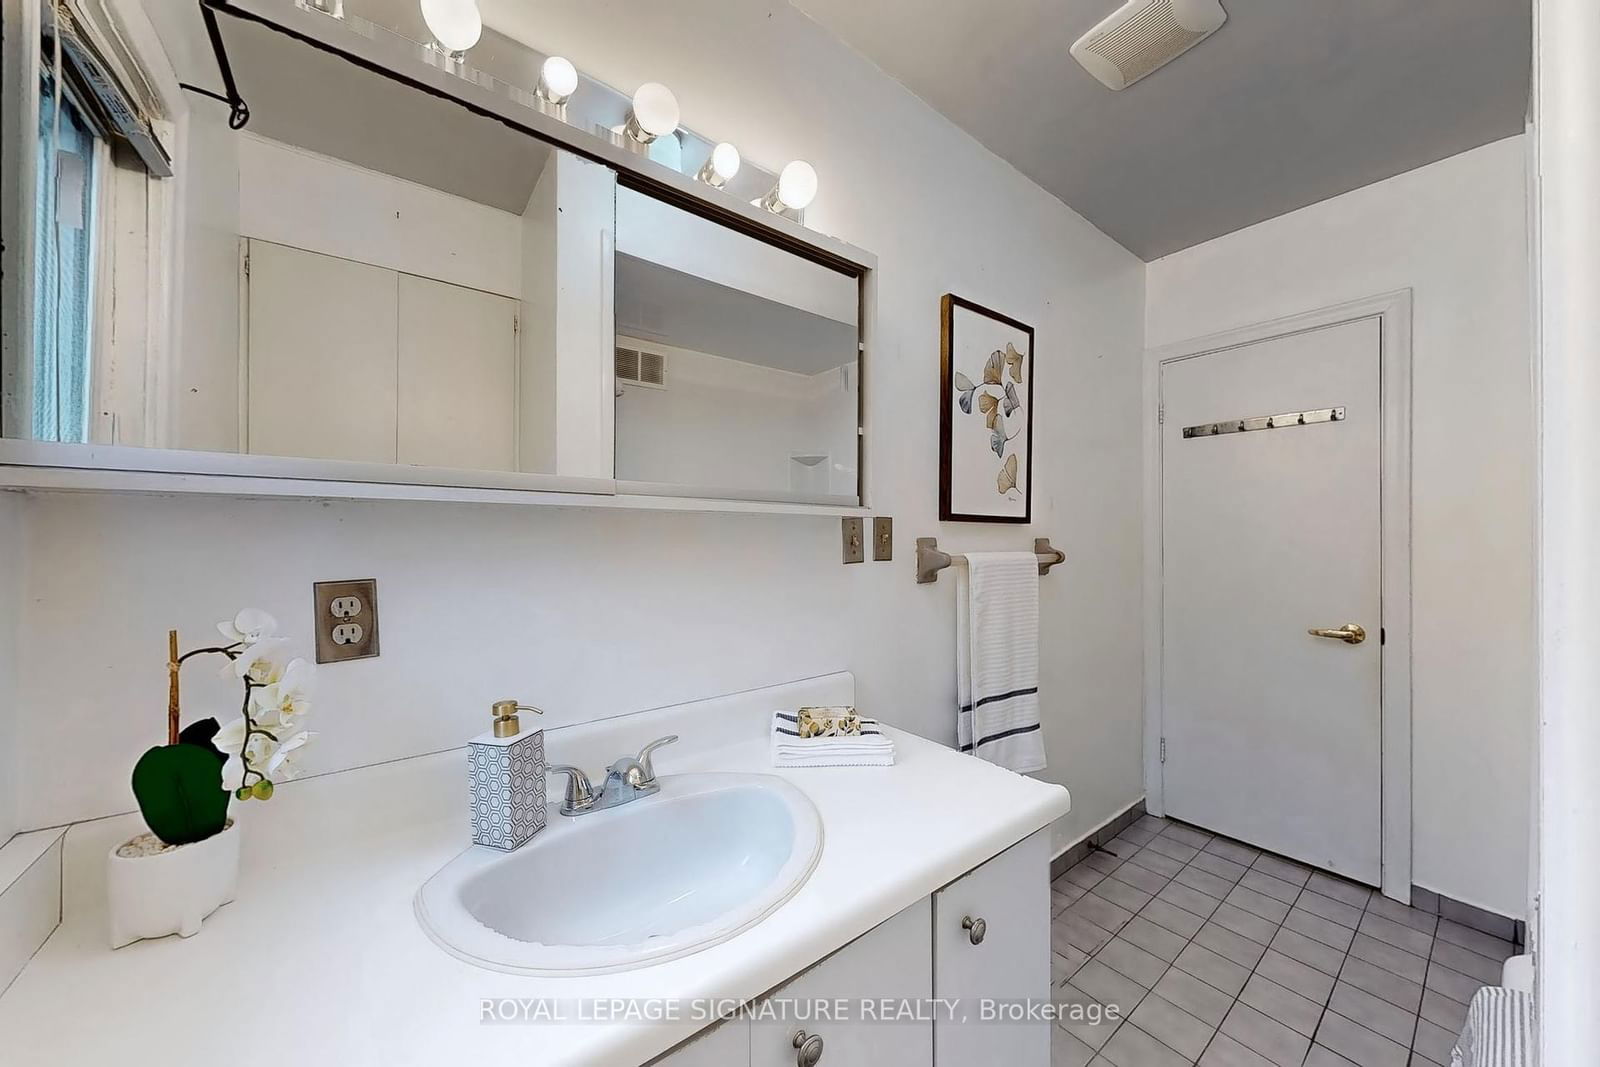
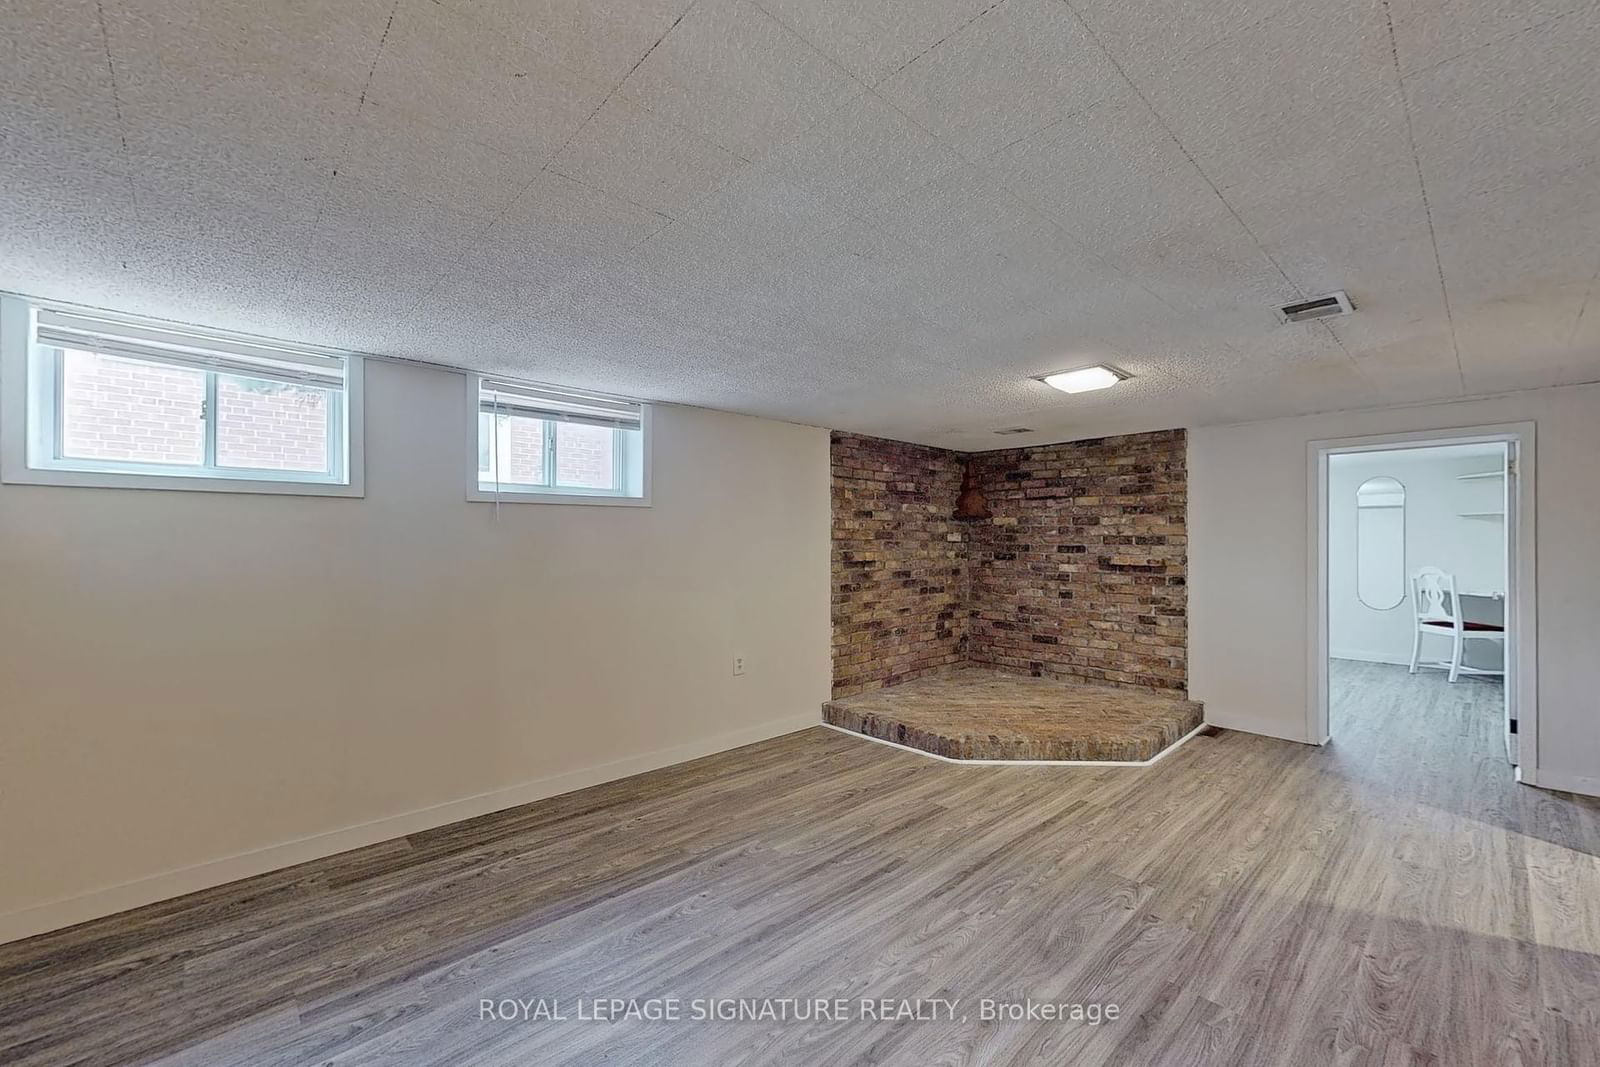
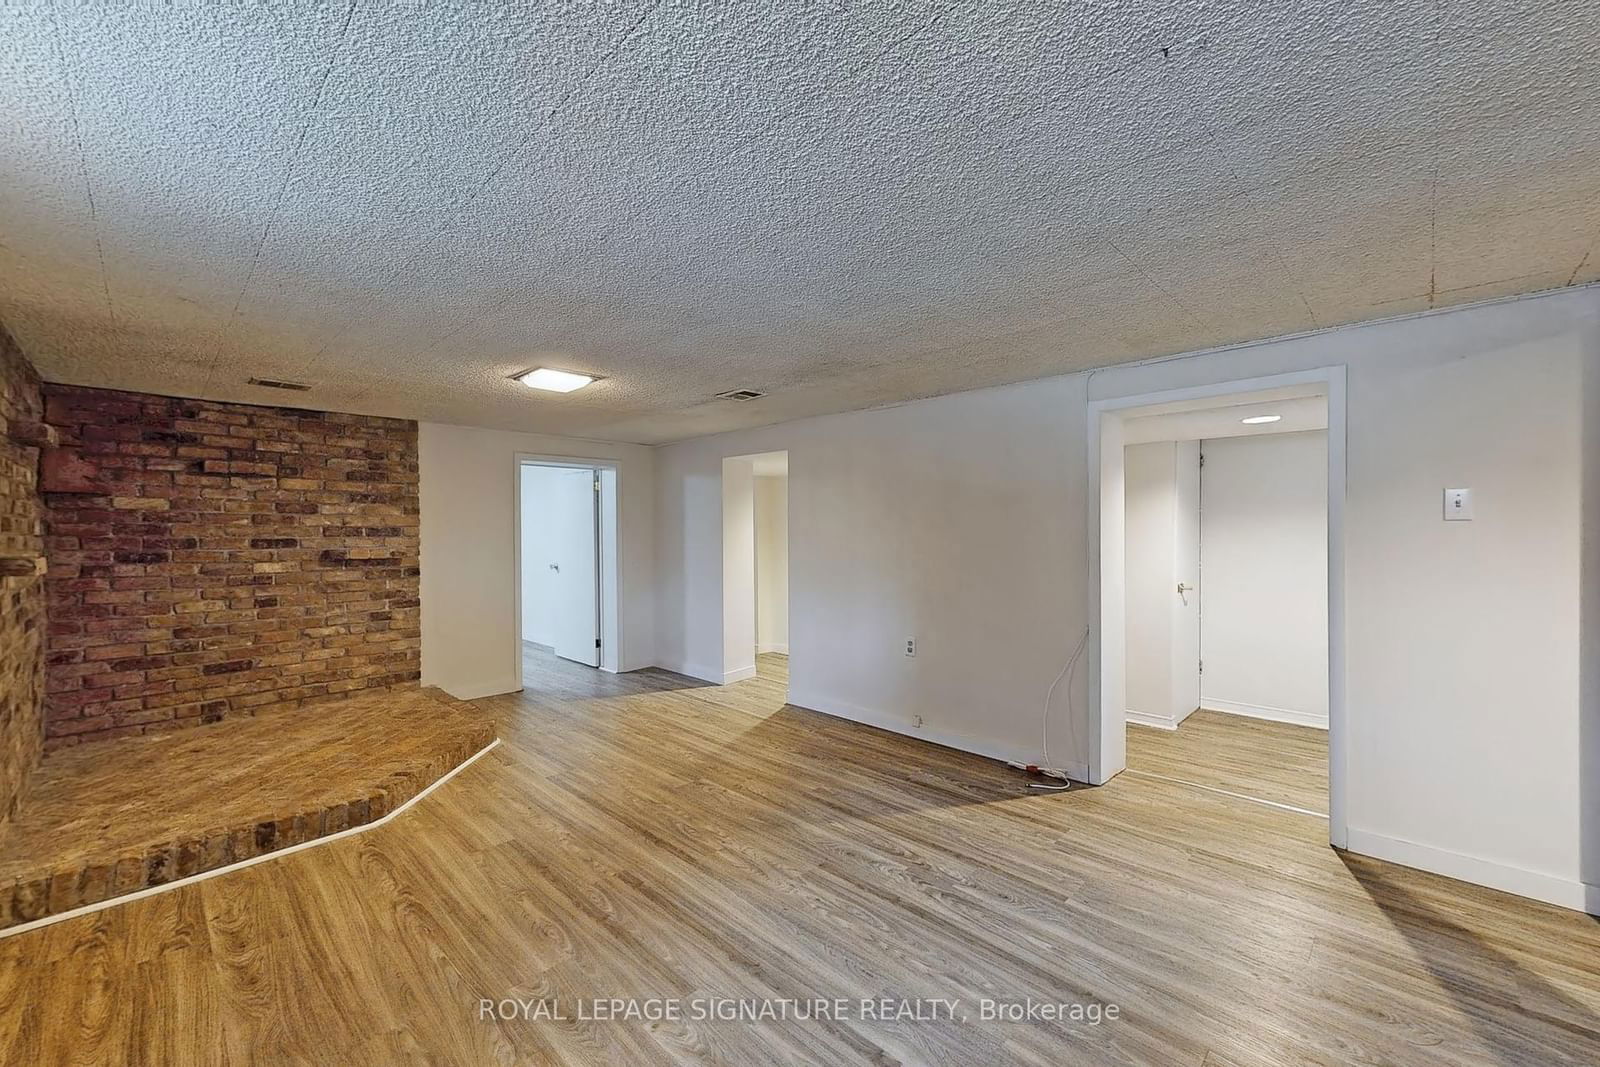
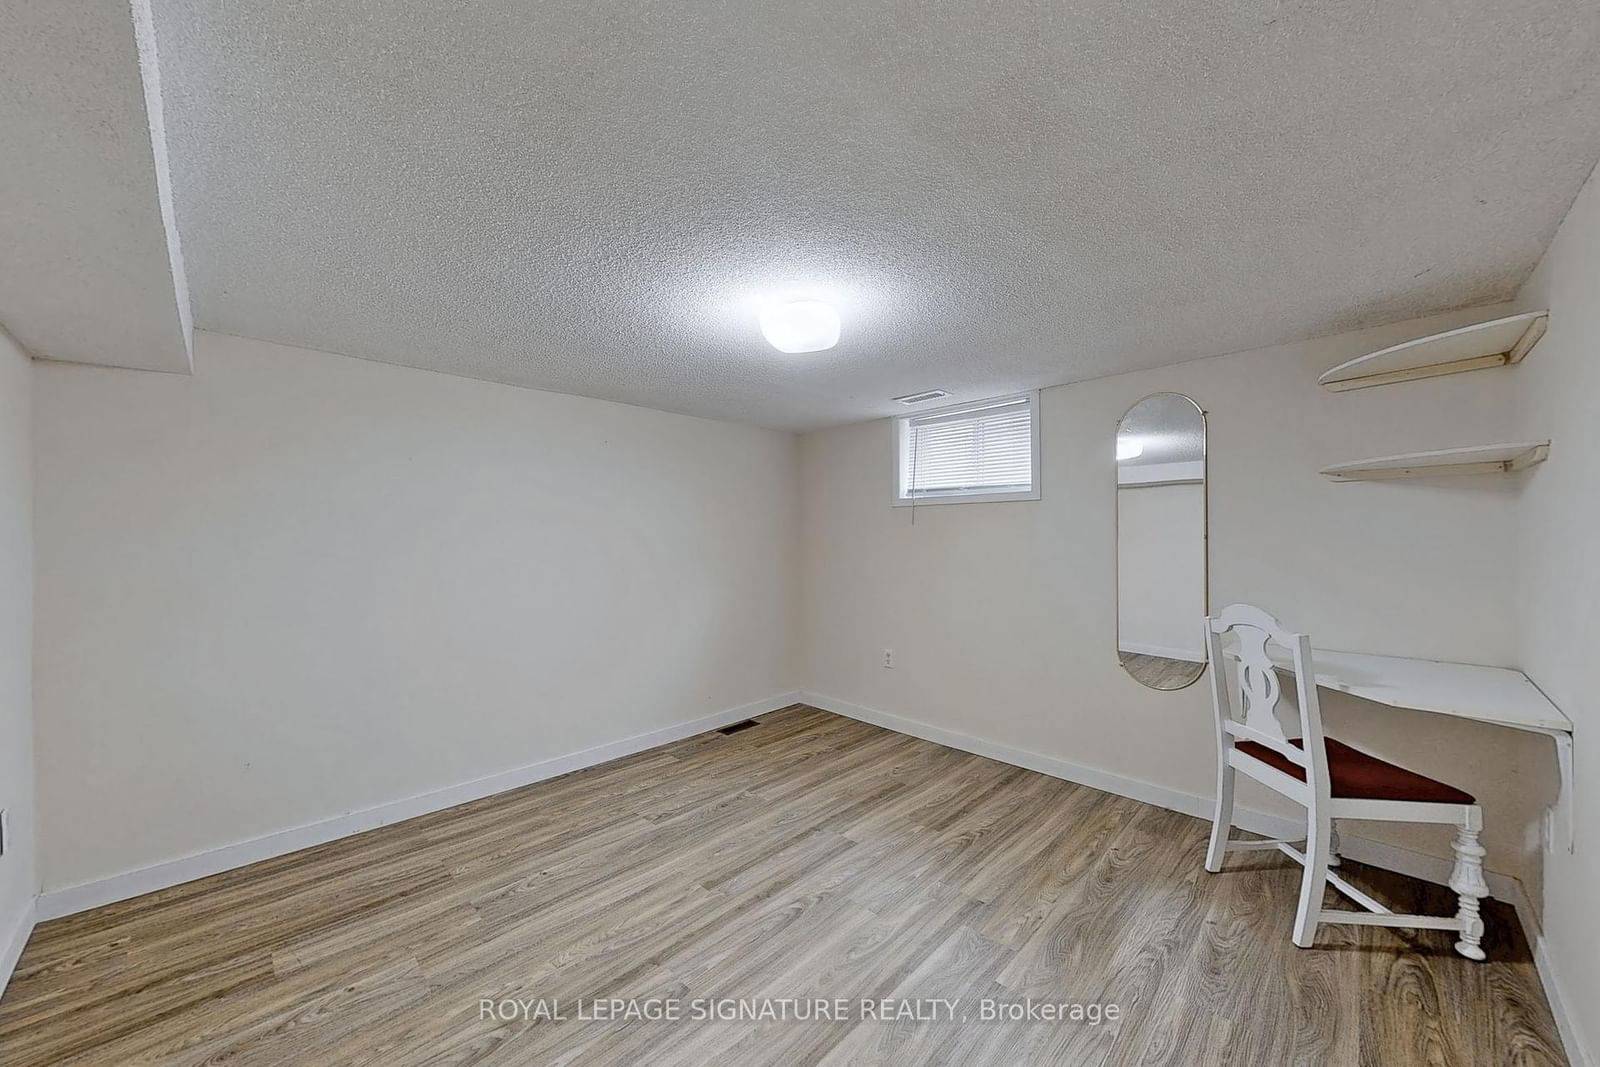
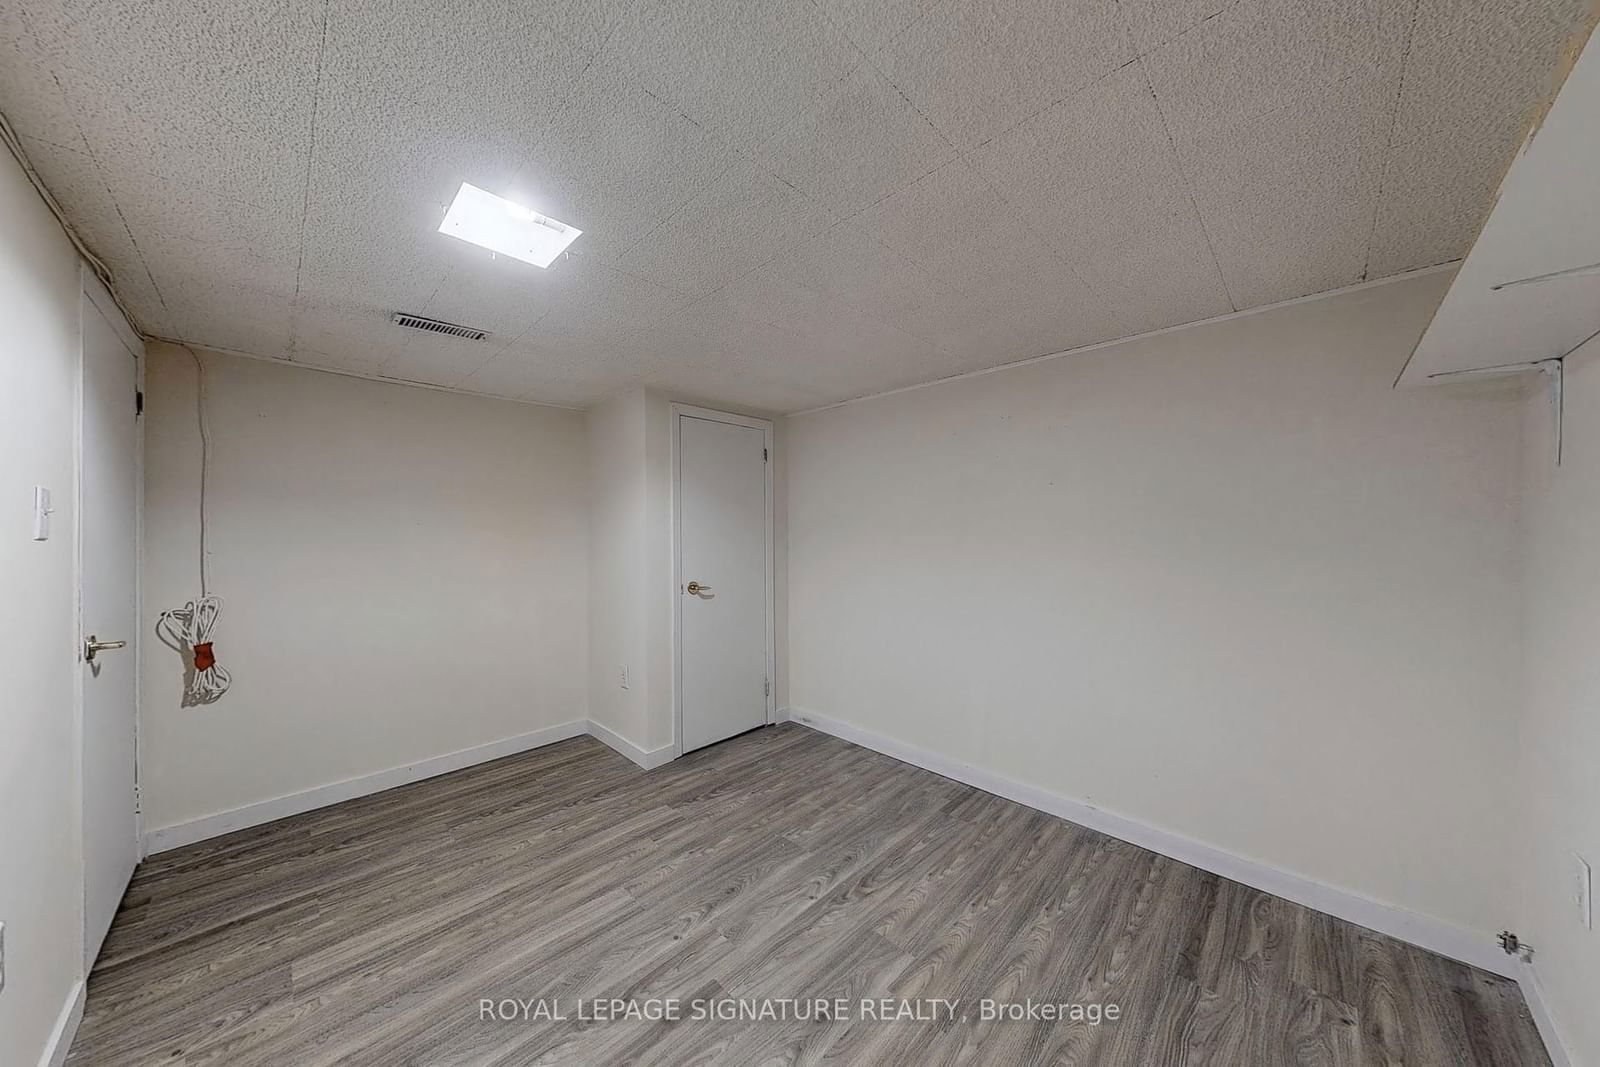
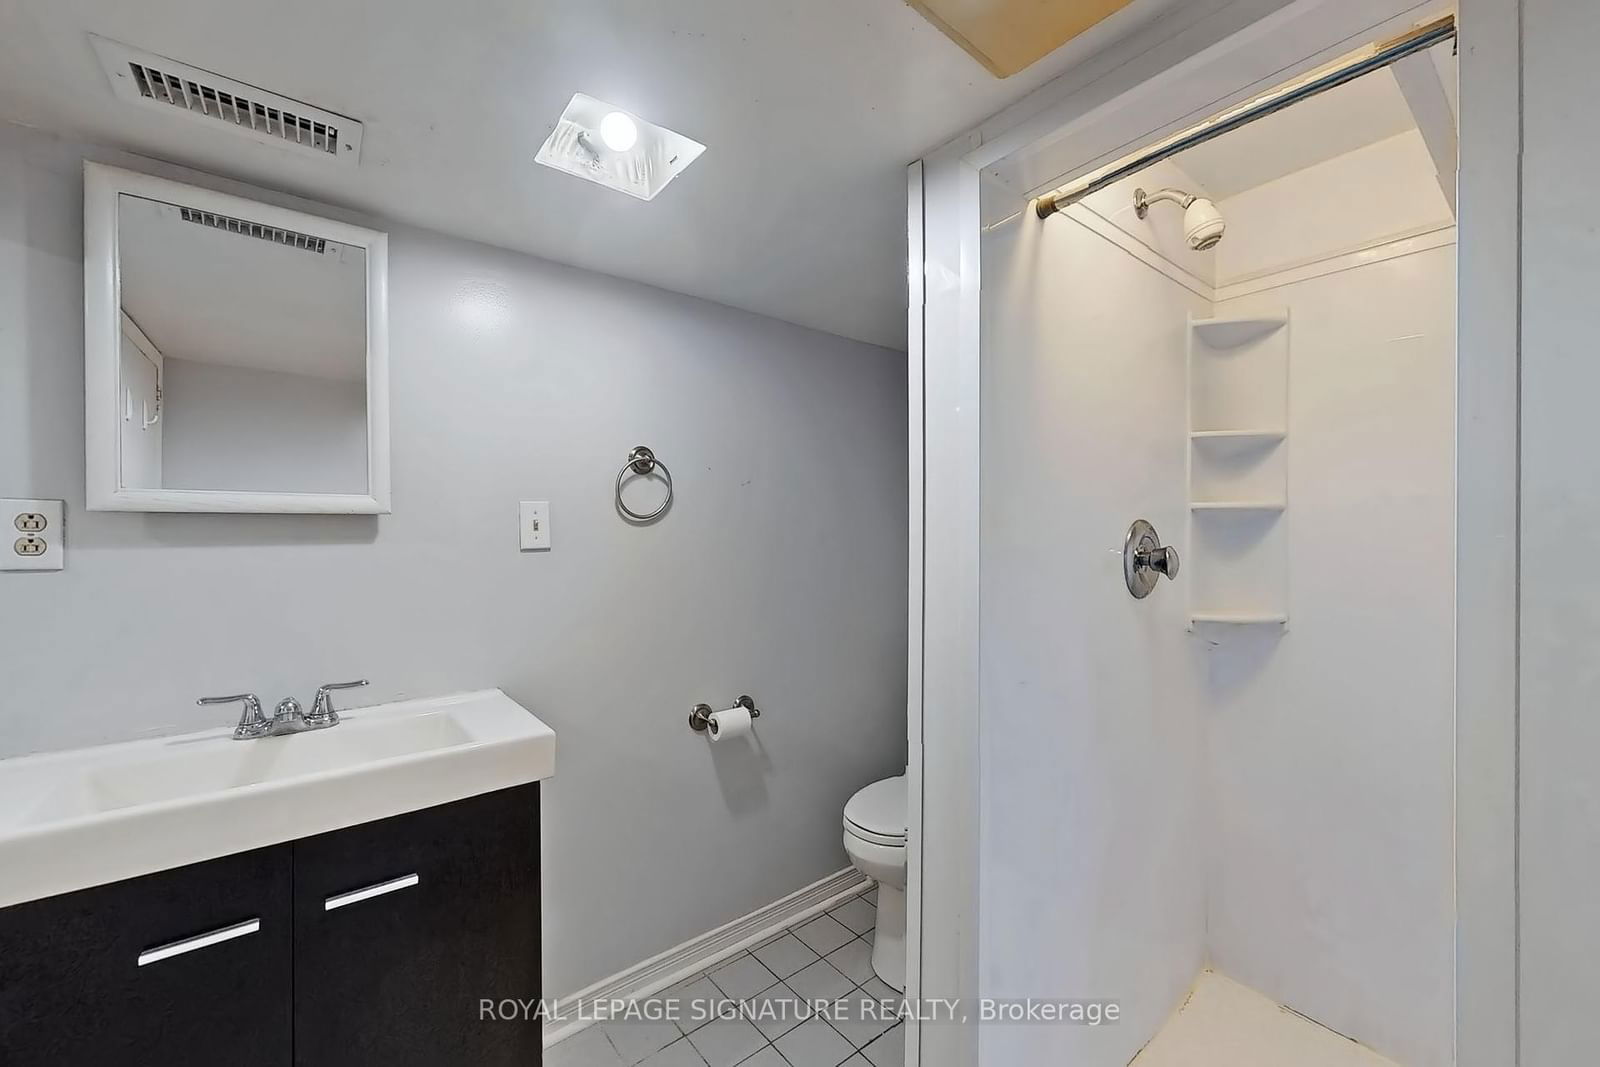
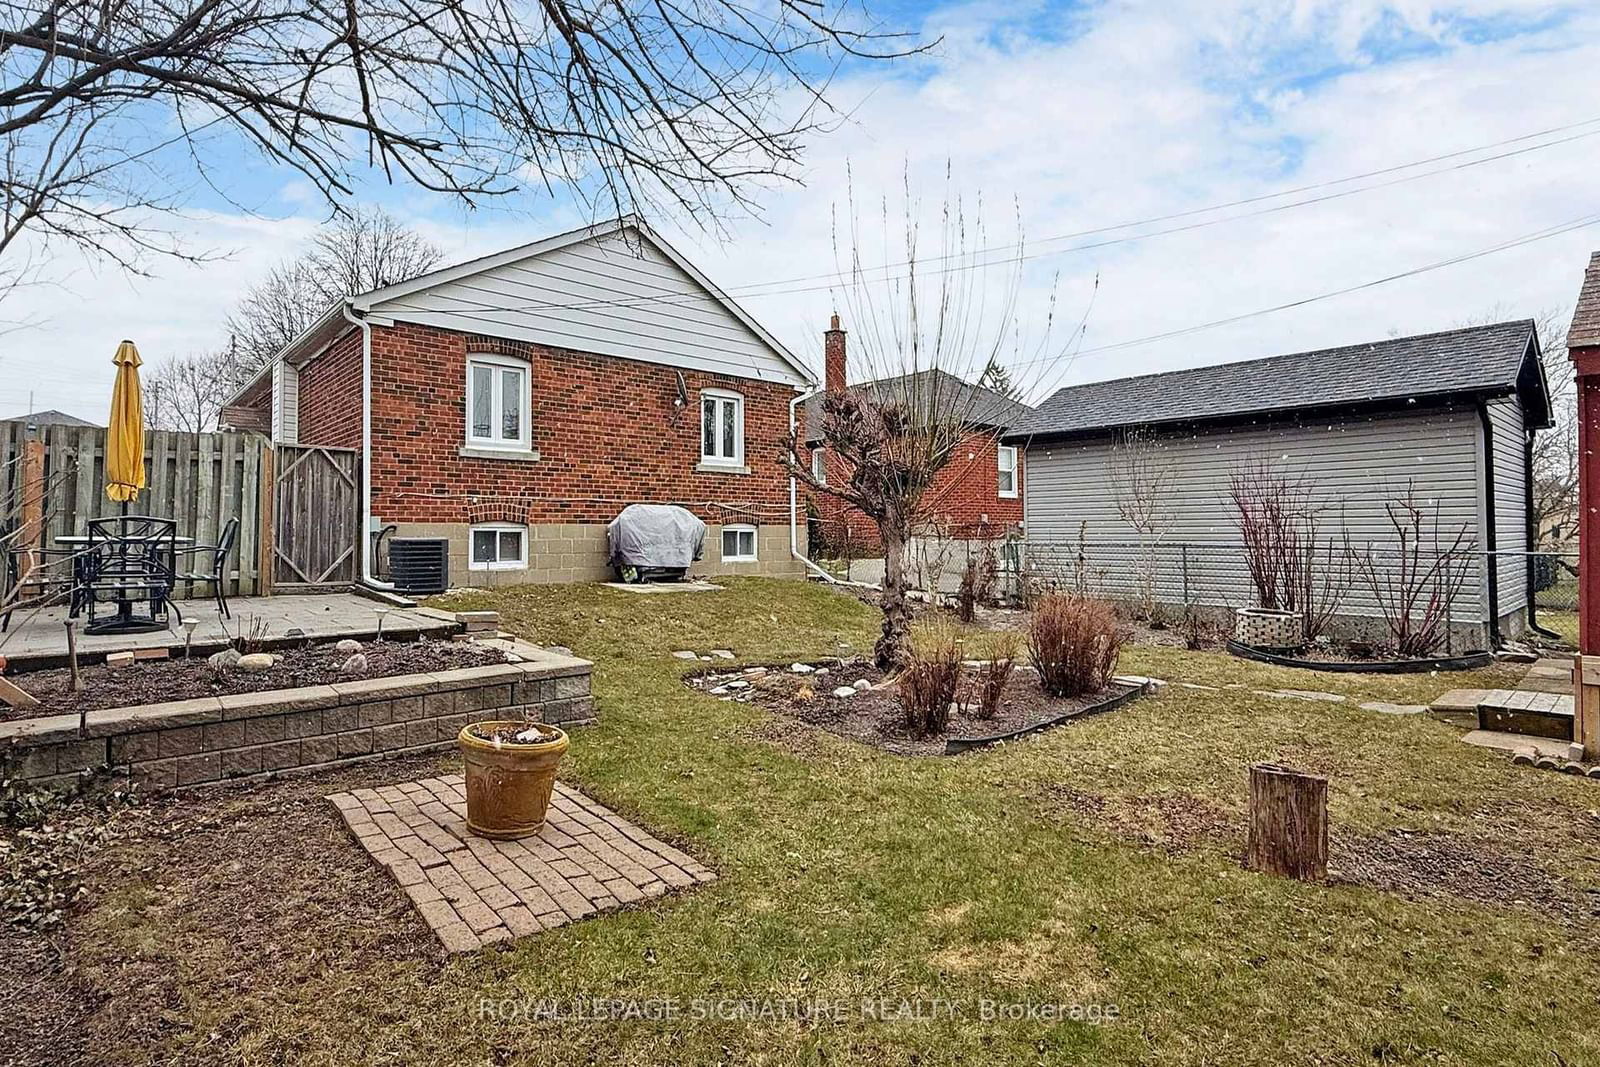
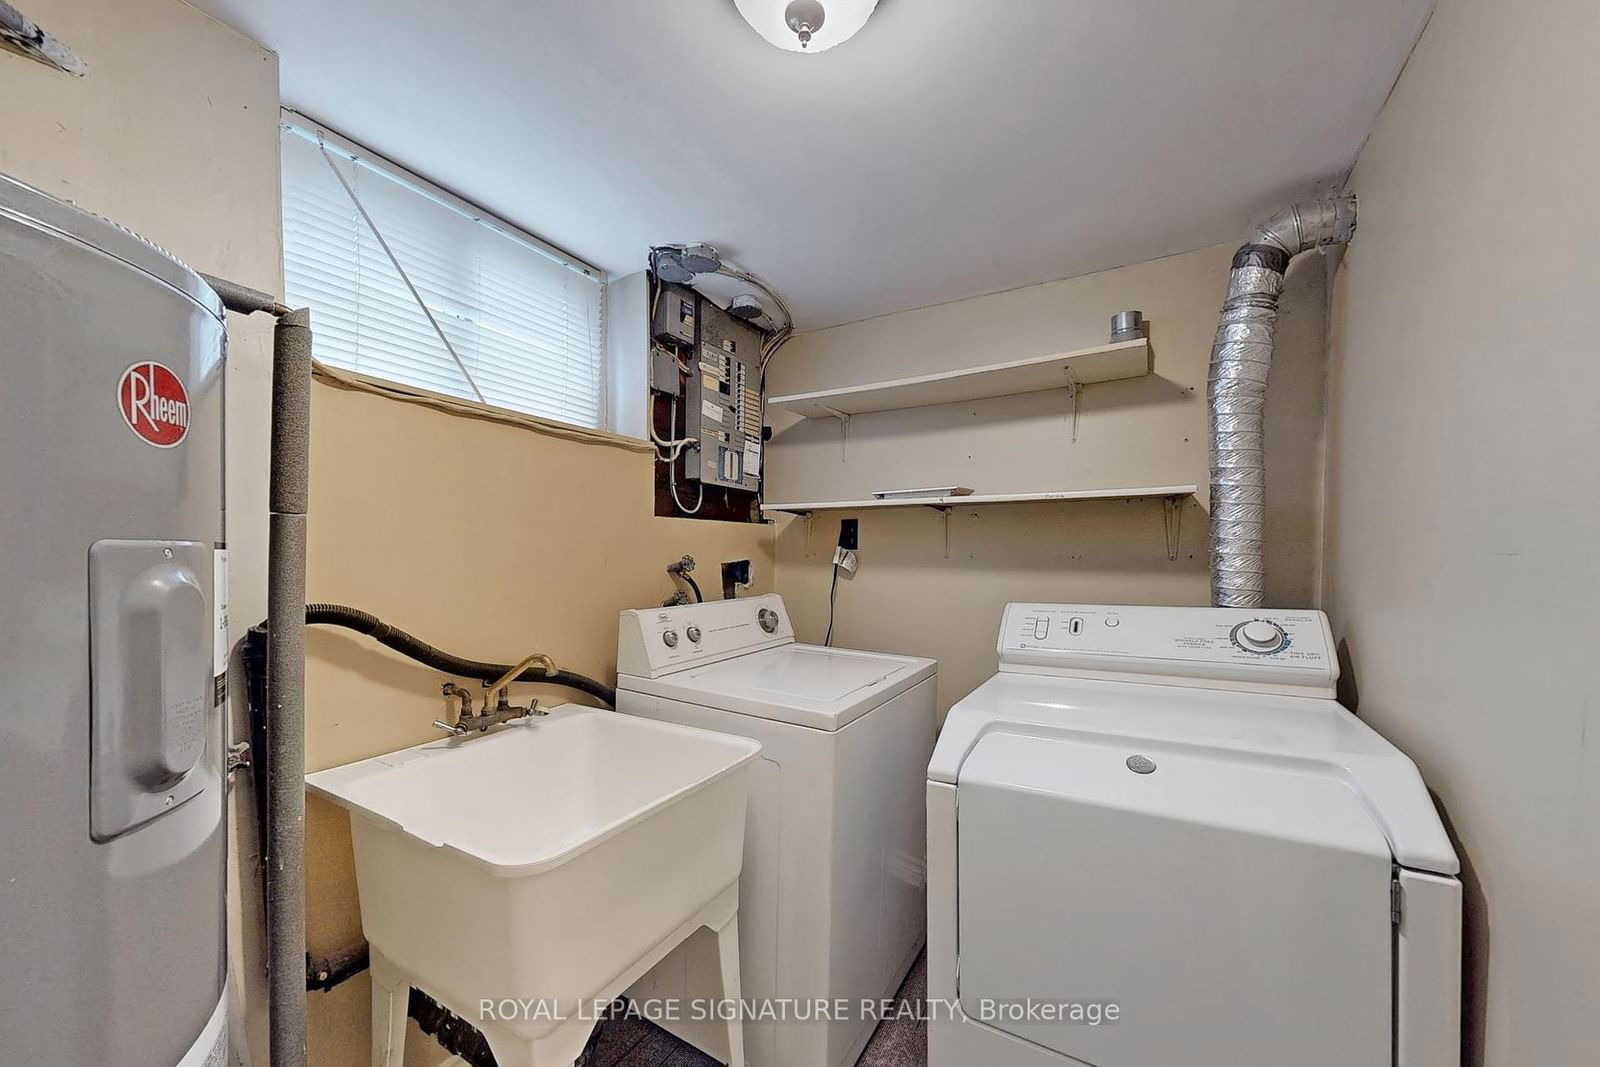
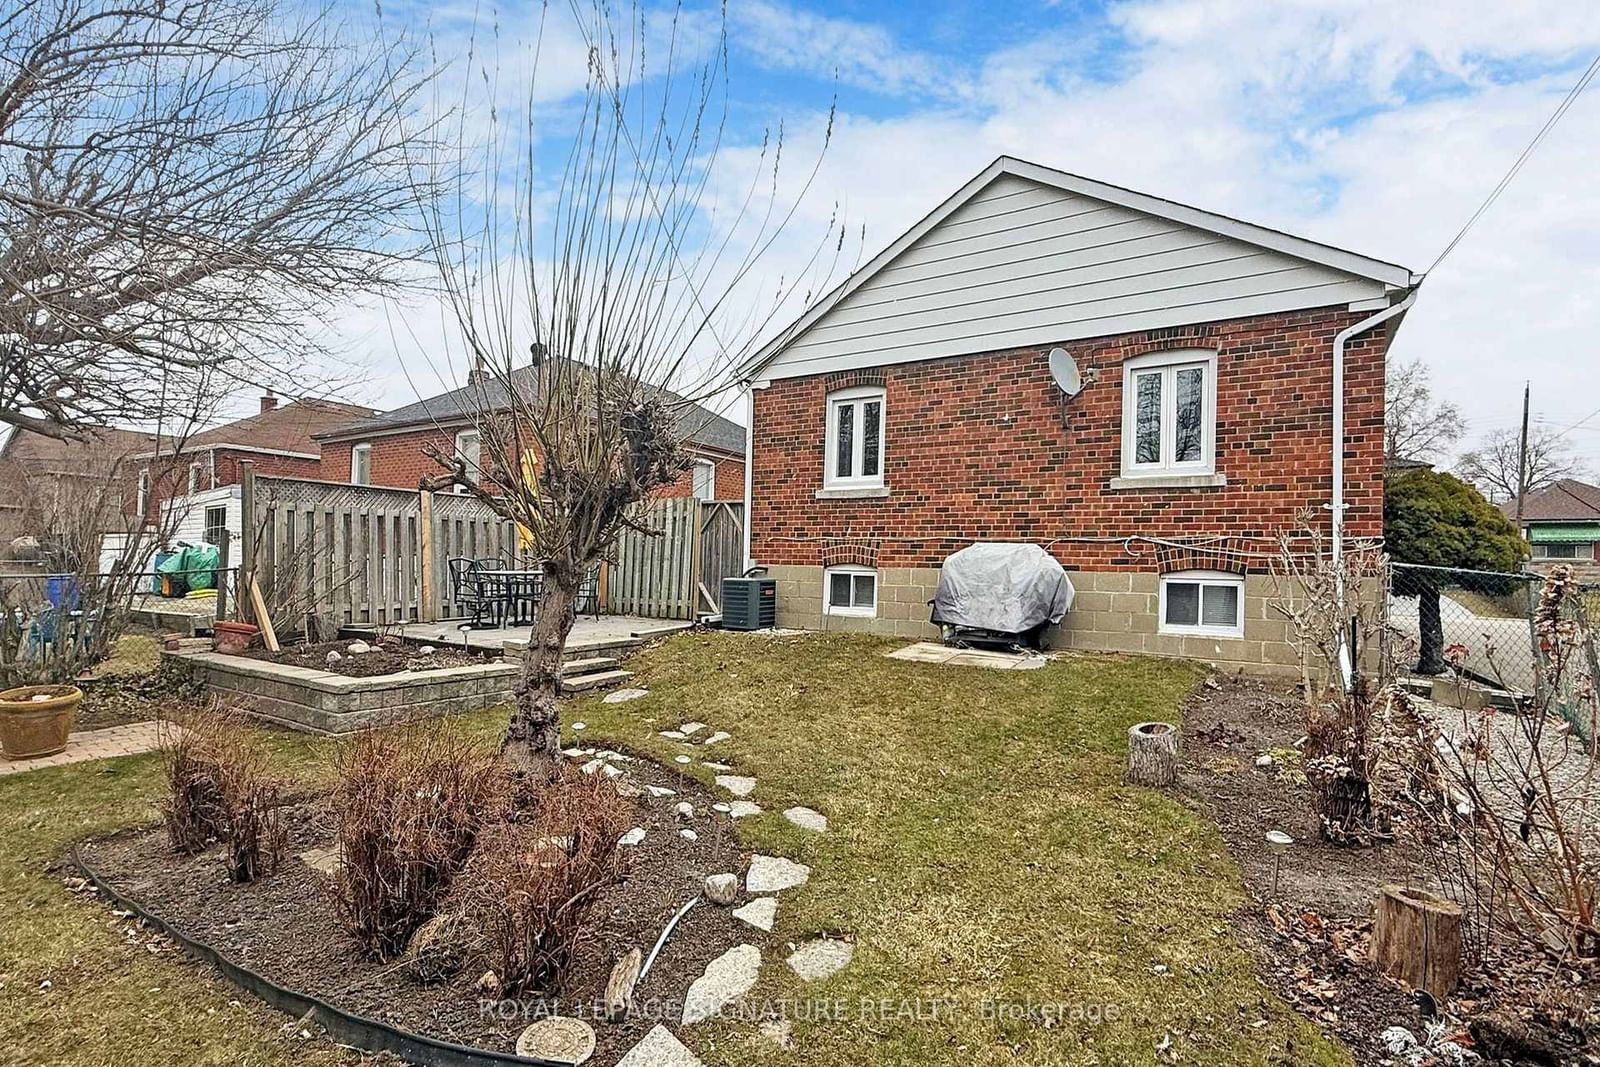
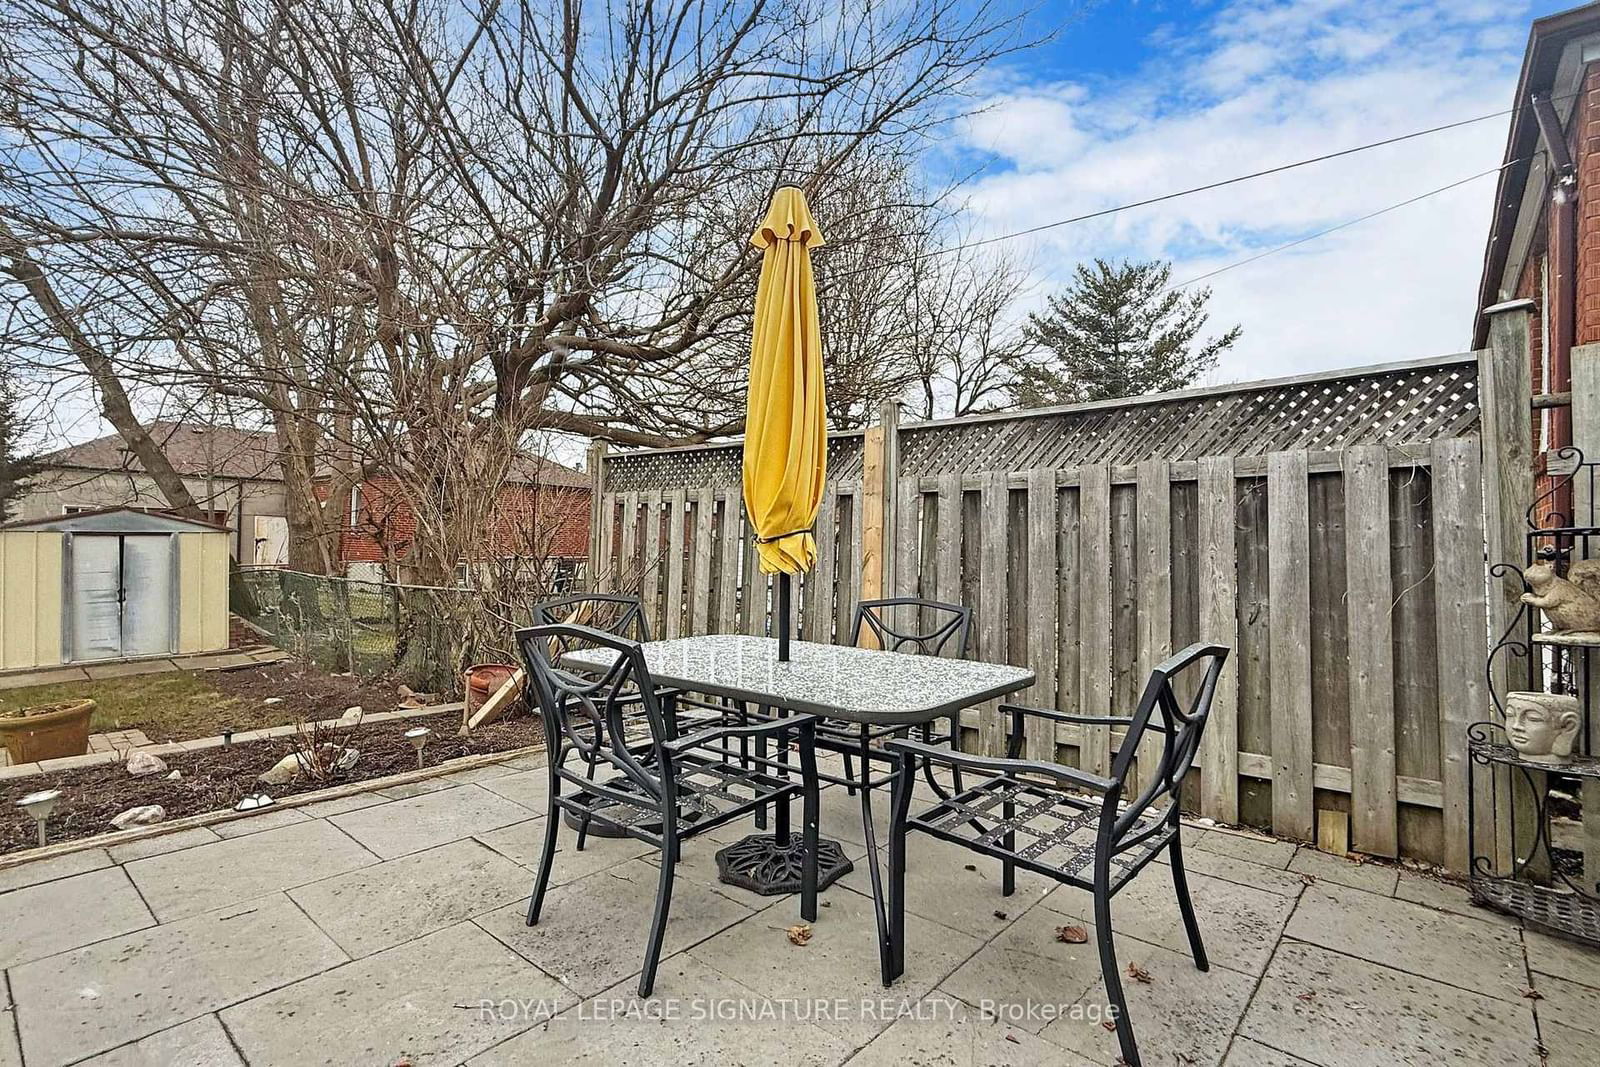
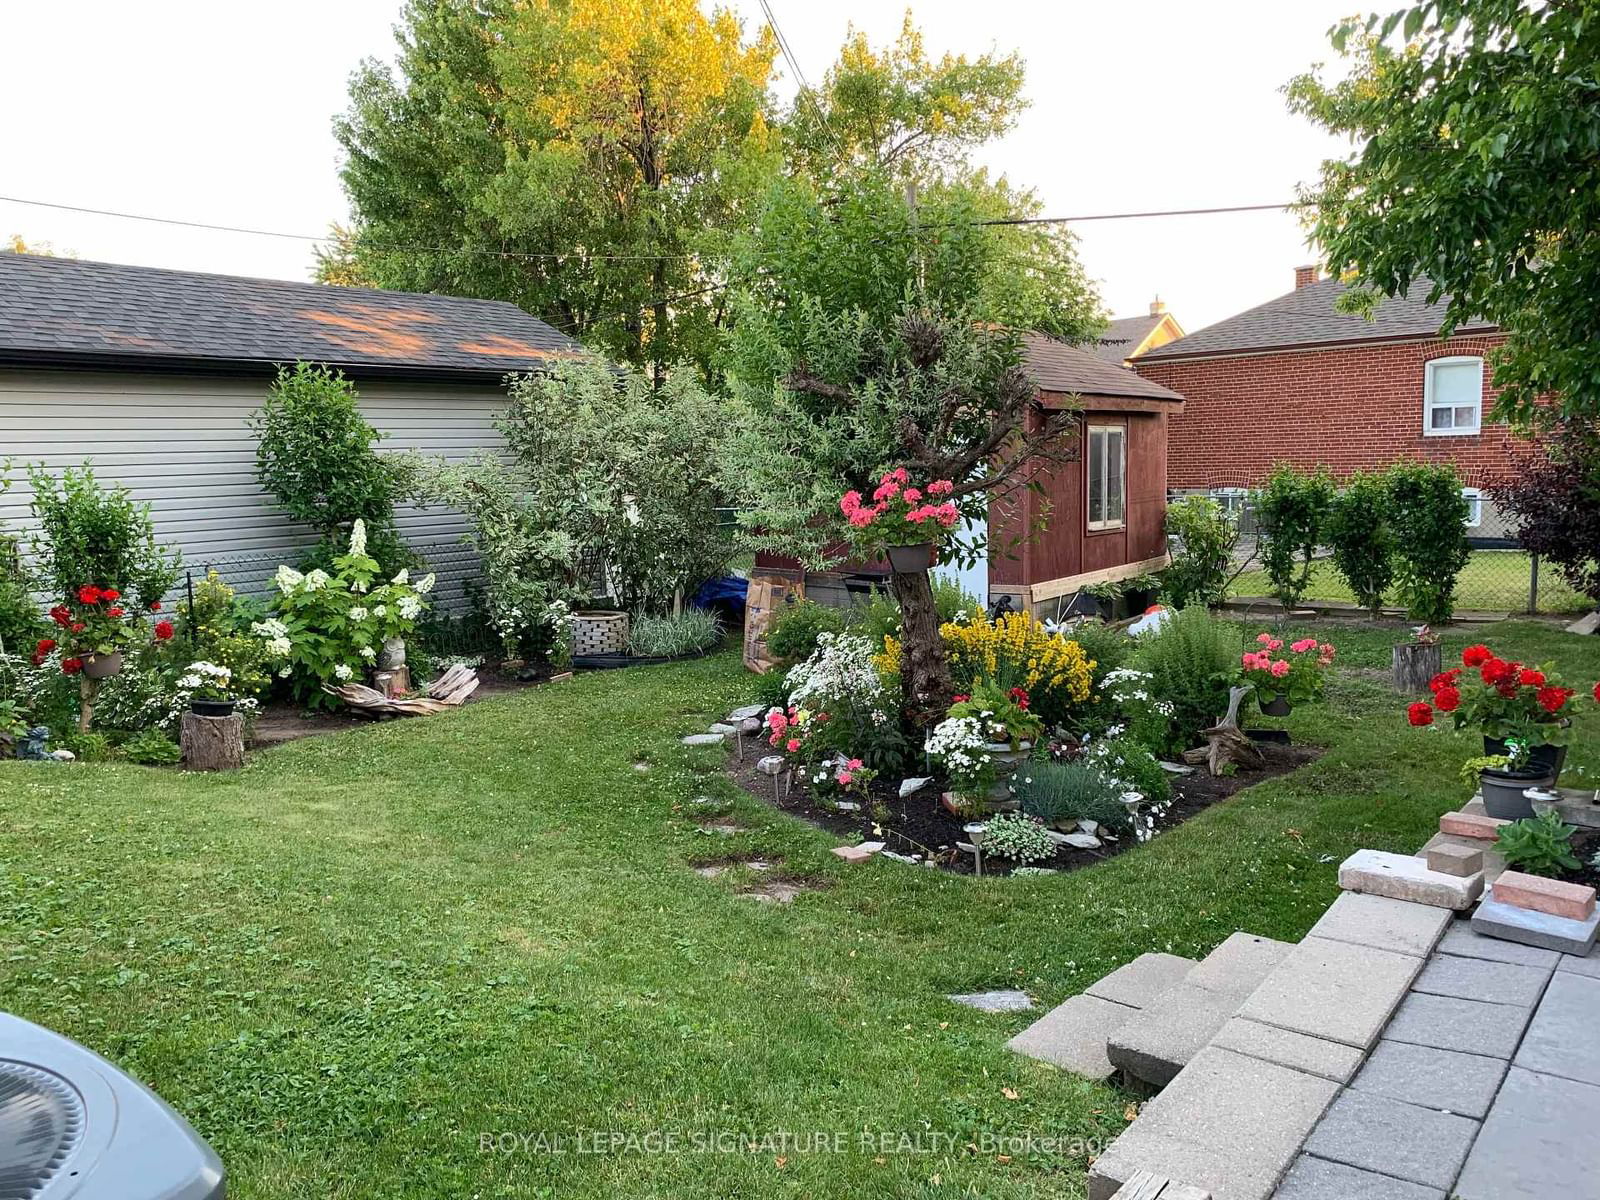
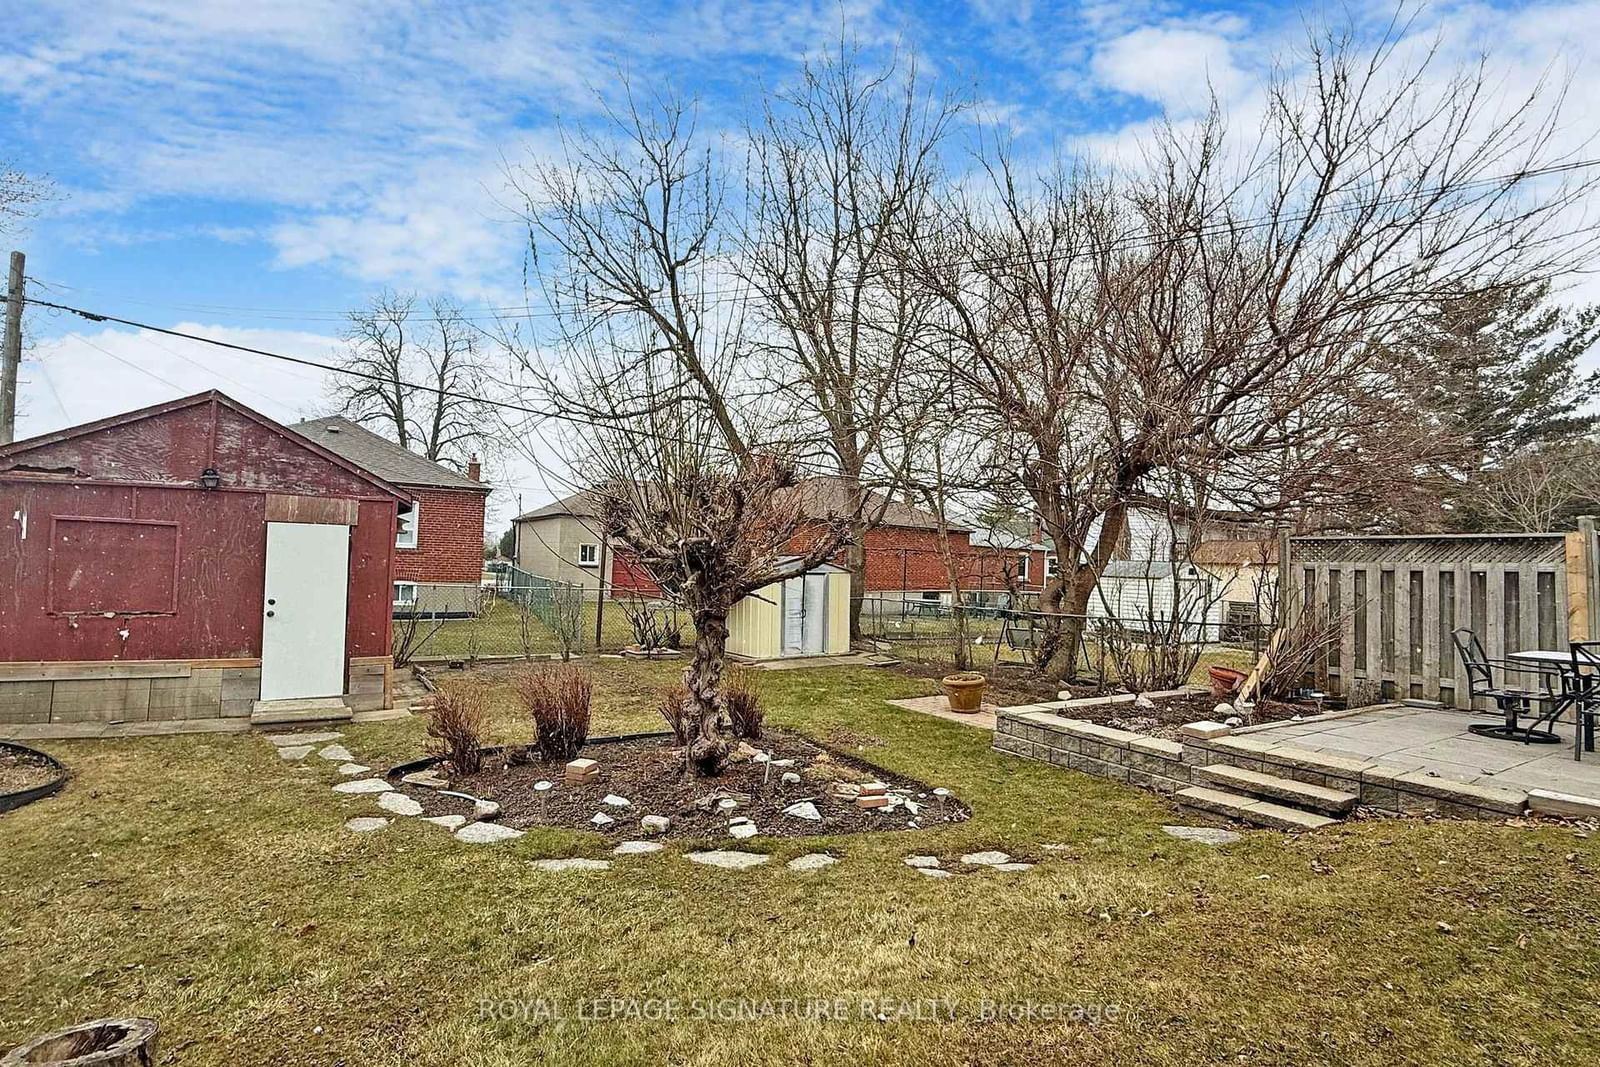
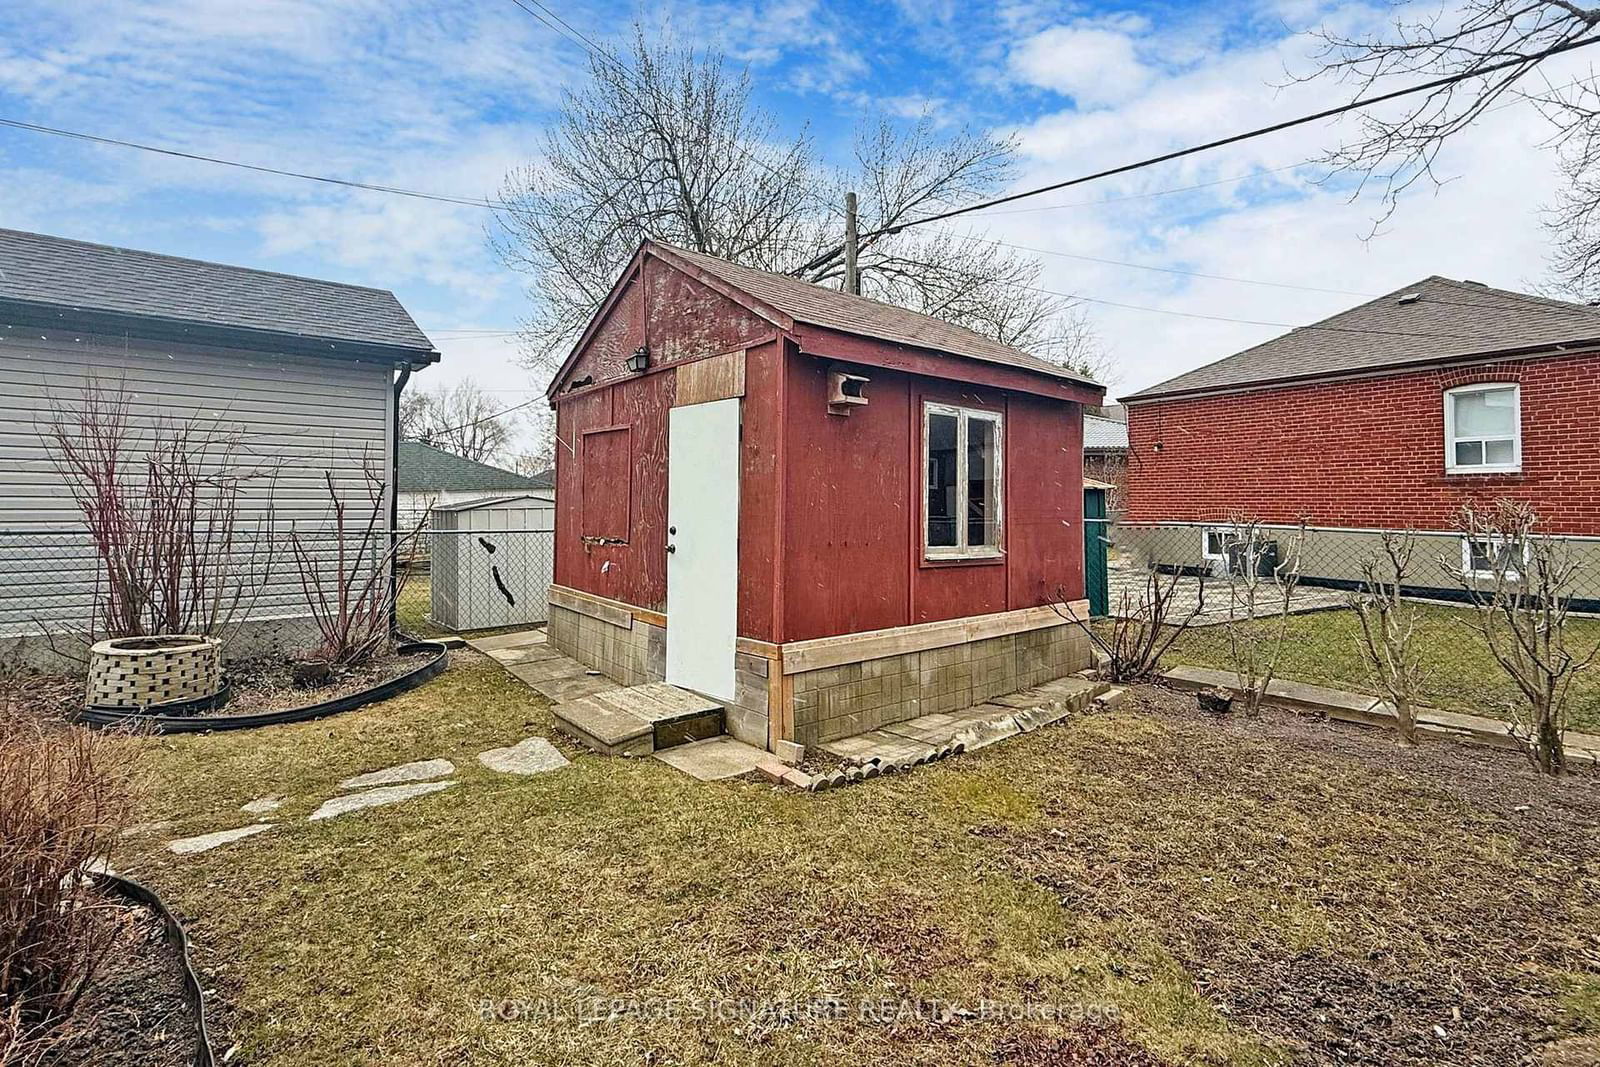
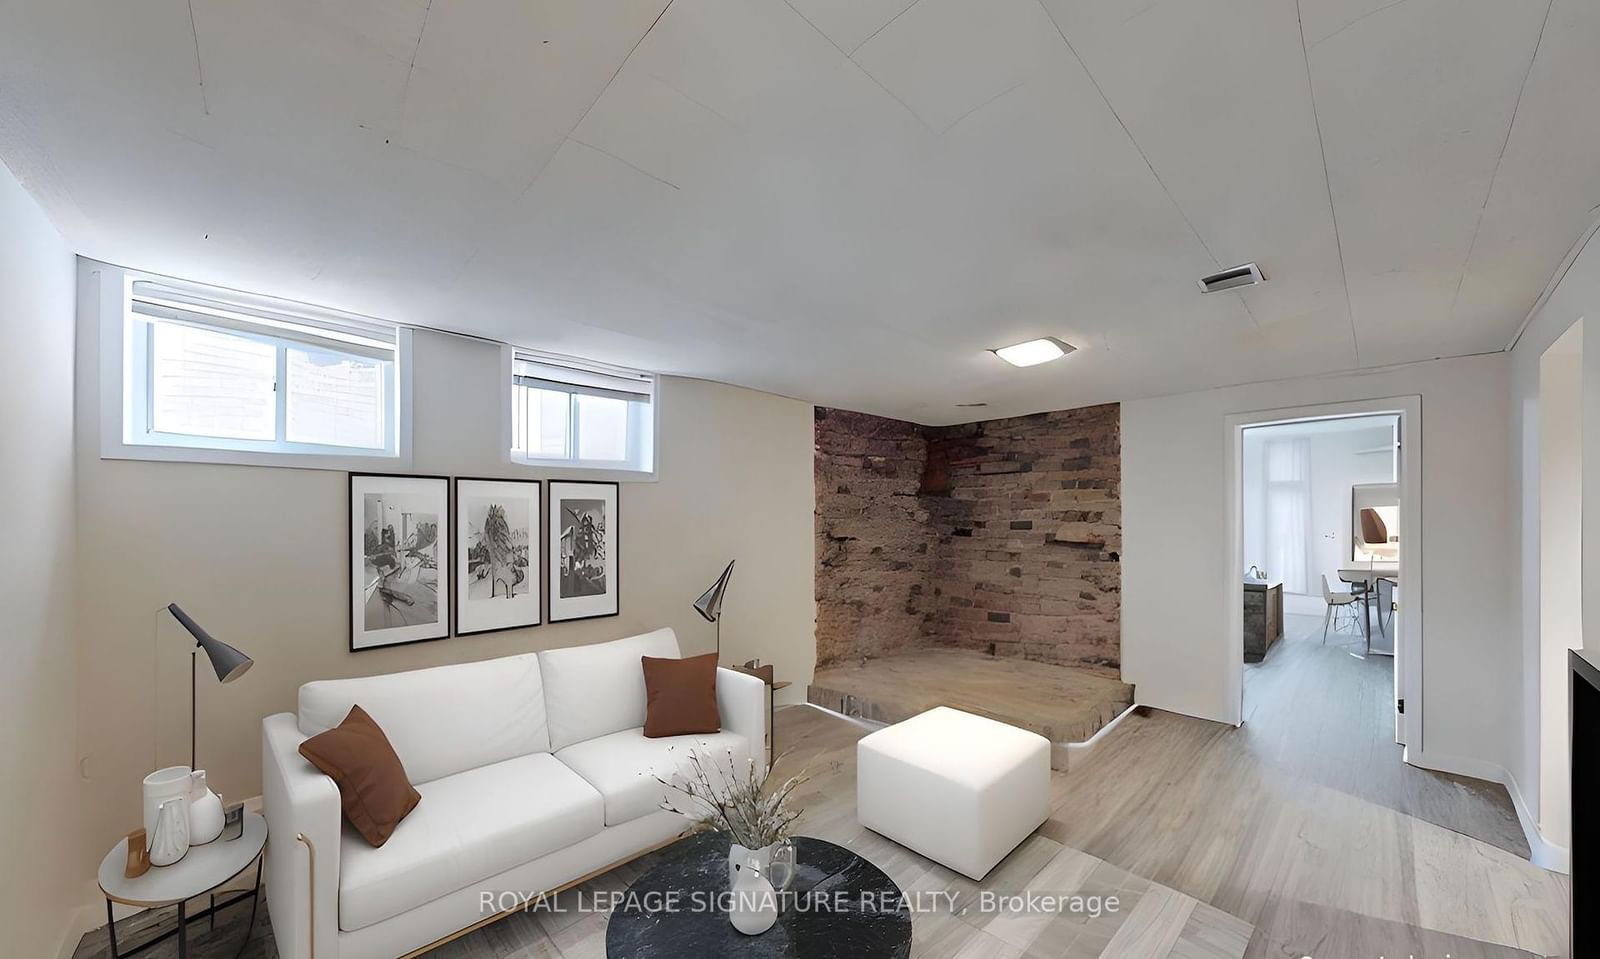
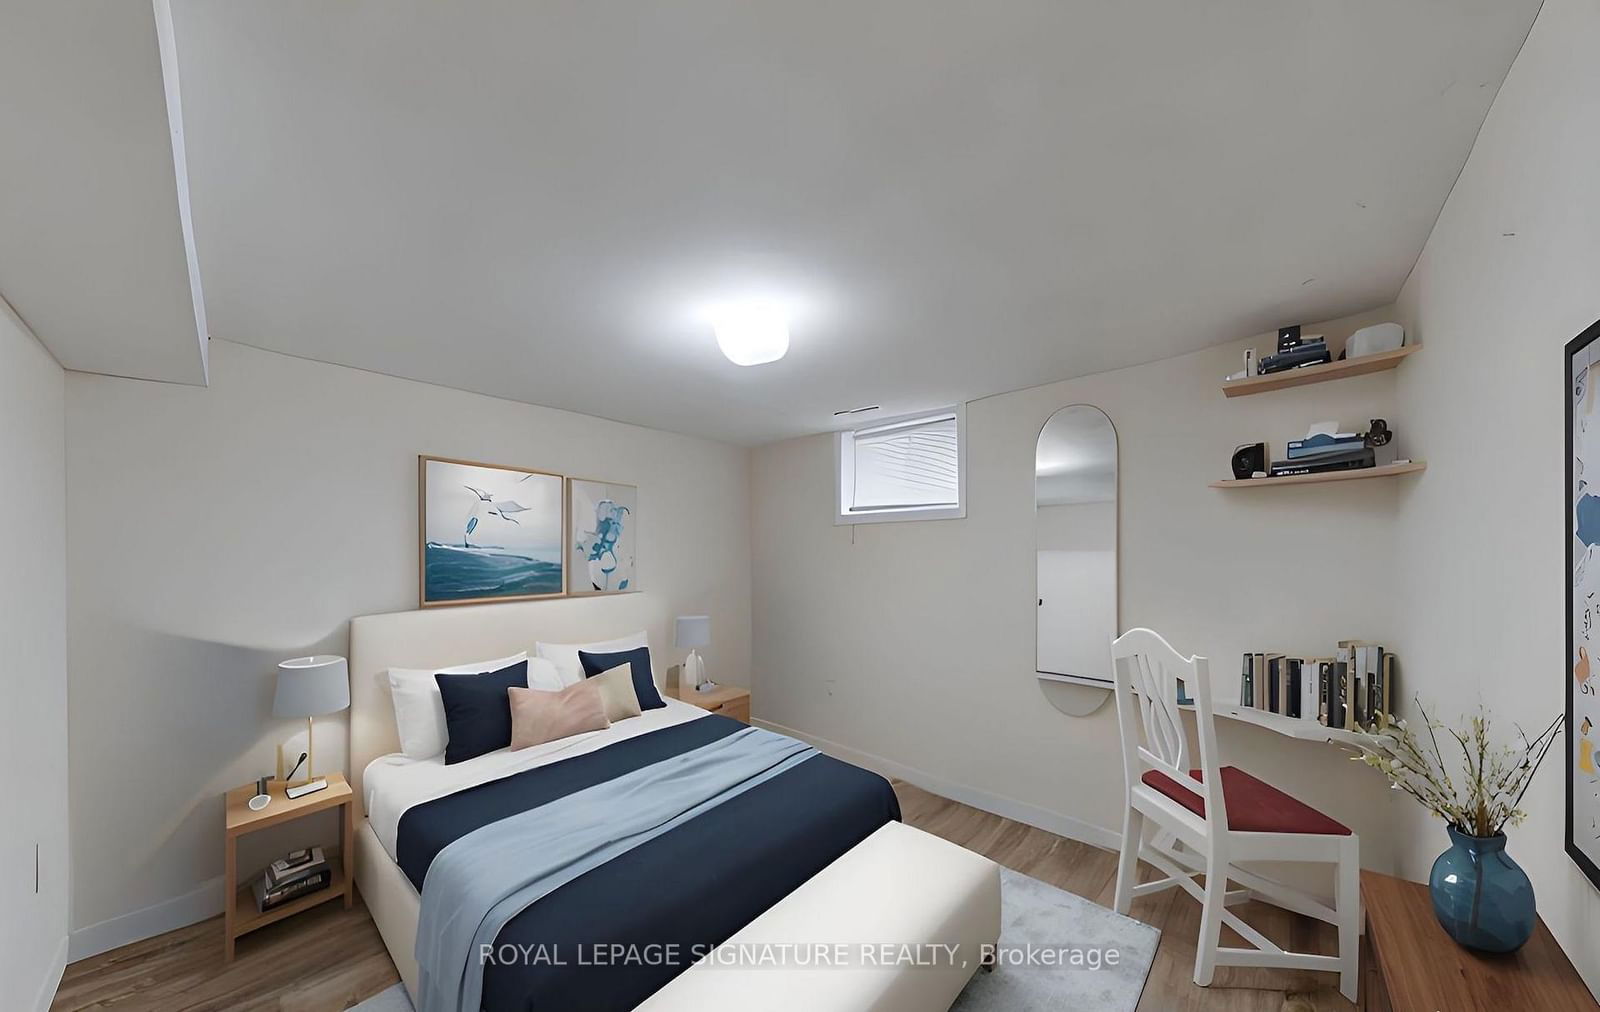
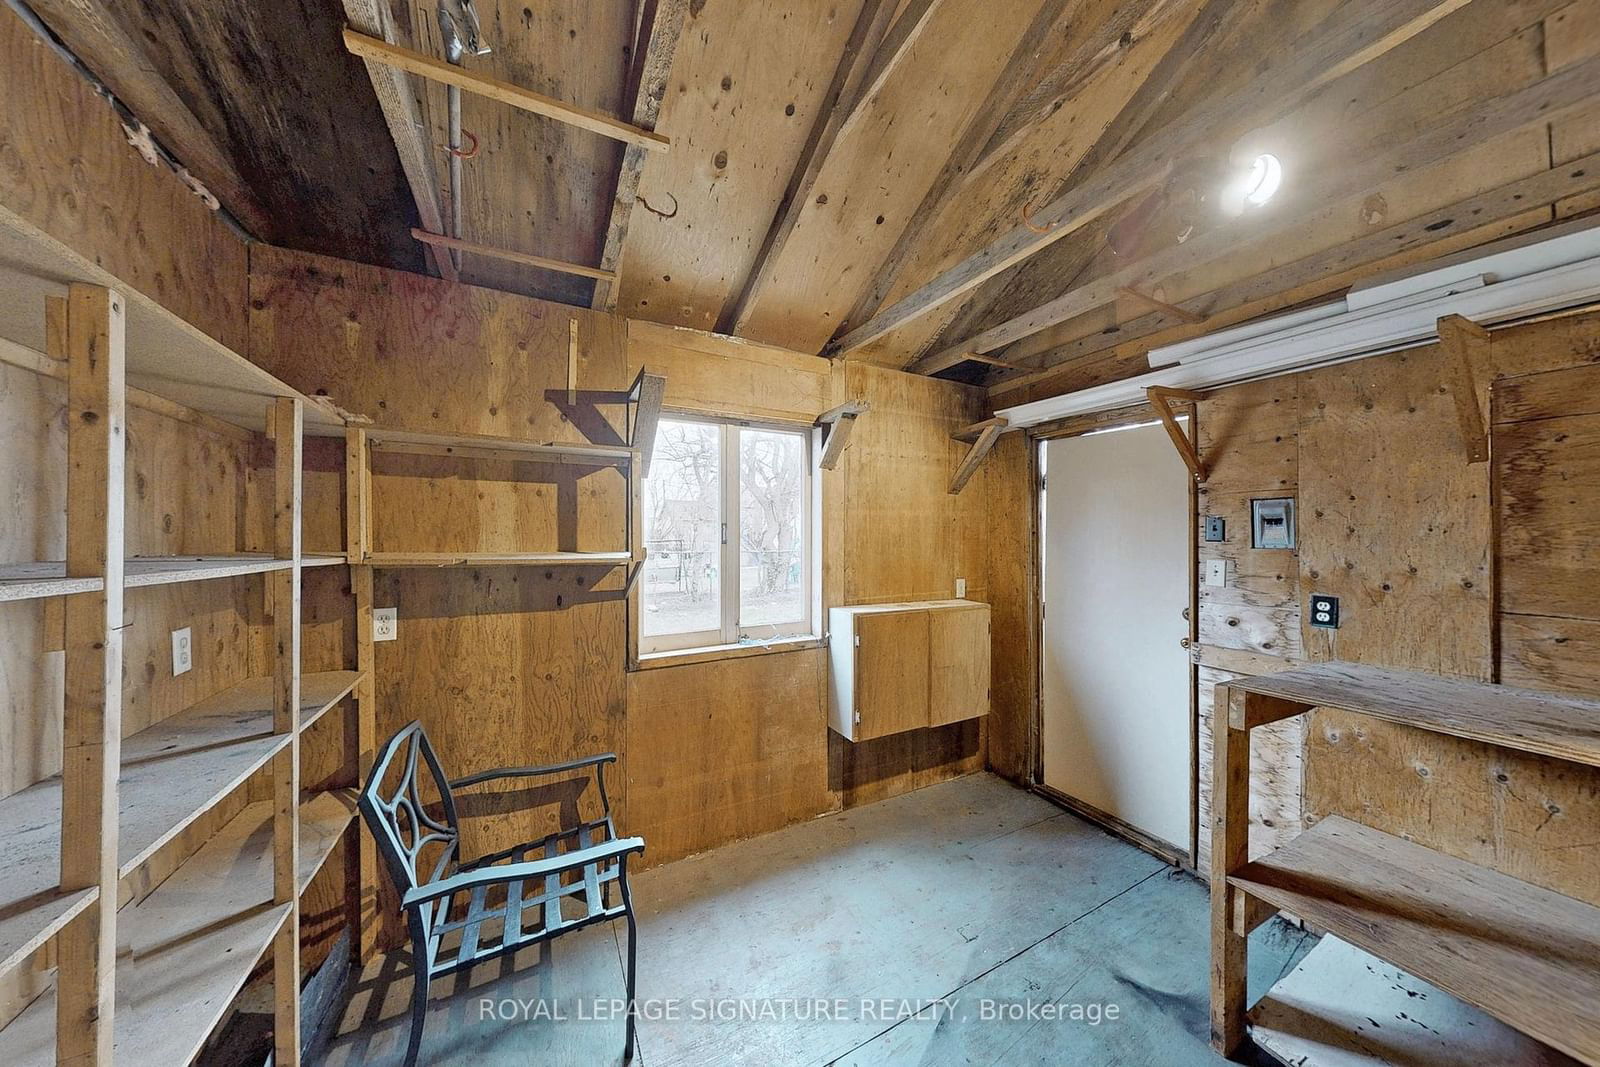
Charming solid brick bungalow on large 45 x 115ft lot in family friendly Ionview community! Featuring 3 bdrms on the main + 1 bdrm in the updated bsmnt suite, w/private side entry- a perfect layout for 1st time buyers, multi-generational families & investors alike. Private driveway can accommodate 4 cars! Many updates throughout & tons of potential to perfectly tailor this home to your lifestyle. Fully fenced bckyrd w/lush gardens & sunny stone patio- great for dining, entertaining & relaxing. Garden shed for outdoor storage, plus large workshop equipped w/electricity. A unique space that could be converted to a cool studio, office or kids playhouse- the possibilities are endless! Desirable neighborhood close to parks, schools community cntrs & shops. Walk to Kennedy TTC station- a MAJOR EAST-END TRANSIT HUB, undergoing extensive expansion w/access to 23 bus routes, new pedestrian plaza & future proposed Eglinton East LRT. The entire area is undergoing major revitalization- upcoming development plans will bring more retail, improved community amenities/public spaces, pedestrian & cycling infrastructure. Some Photos are virtually staged. High Efficiency furnace-2022, A/C Unit-2019, Hot Water Tank, -2024, Sump pump-2023, Fresh paint in liv/din rms & entryway, newer siding & eavestrough at rear, recent waterproofing on the North Side at rear.*Please note: basement living rm & bedroom photos are virtually staged*
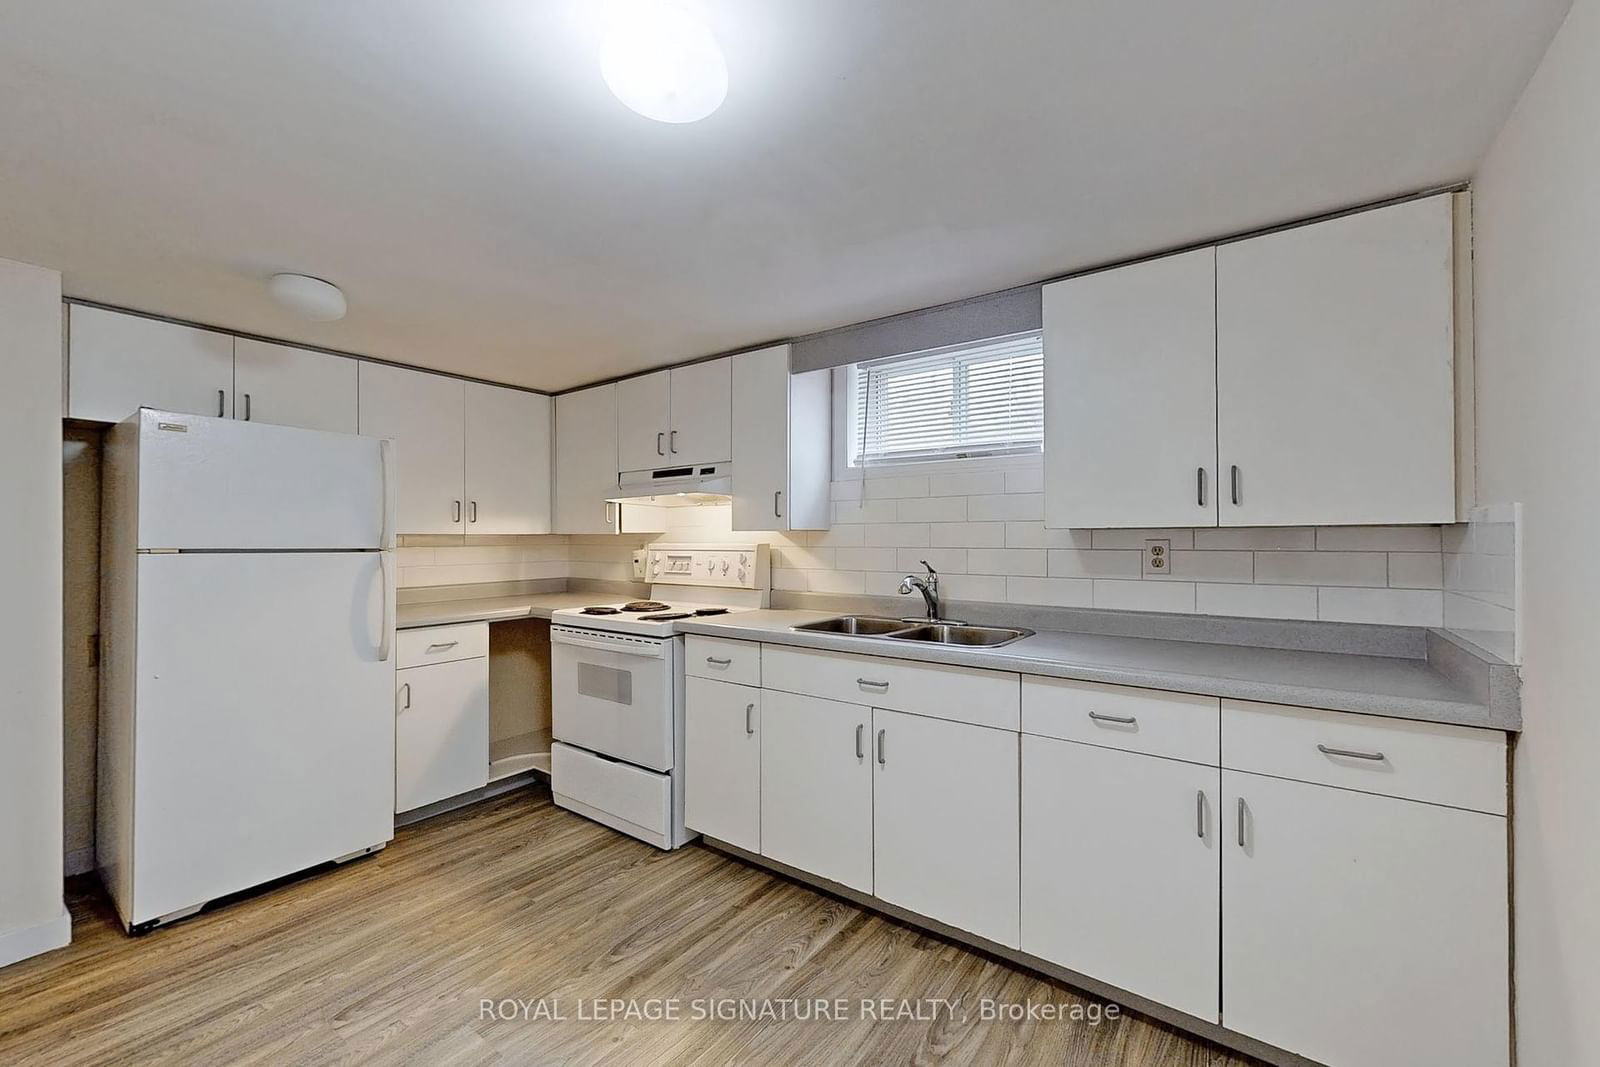
2 Fridges, 2 Stoves, 2 Hood fans, Washer & Dryer, Laundry Sink, Electric Light Fixtures, Backyard Workshop & Garden Shed, Main Floor Washroom Medicine Cabinet, B/I Desk, A/C Unit, FAG Furnace.
Kitchen
Living
Dining
Primary
2nd Br
3rd Br
Living
Kitchen
Br
Other
Utility
The graph below compares the average list price and average sale price of homes in this neighborhood by month for the last 24 months. When average sale price is greater than average list price, this may suggest a buyer's market. When average sale price is lower than the average list price this may suggest a seller's market.
The graph below illustrates the average days on market for homes in this neighborhood. The yellow area may indicate a buyer's market, the green area may indicate a balanced market and the red area may indicate a seller's market.
Sales Representative, Century 21 People’s Choice Realty Inc., Brokerage
(647) 576 - 2100